What is next for Gold?
A long term technical analysis
of the daily, weekly and monthly charts for Gold
Erich K. Soltes
Oct 17, 2005
Below is an explanation of
varies technical indicators that make up the Alpha Trend System.
In the lower window of the
chart you will see the following indicators.
The main trend line for a security
is the Alpha Trend this is denoted by the bold red line.
It is from this trend line
that all other support/resistance lines are developed. The Alpha
Trend is an adaptive moving average that uses proprietary mathematical
formulas to create the base line movement of the selected security.
From the Alpha Trend I then created three separate progression/regression
price areas using Fibonacci ratios, which I call the 1st Alpha
waves, 2nd Alpha waves and 3rd Alpha waves. It is these three
wave areas that define the vast majority of a security's price
movement. Moving out from the Alpha Trend, the 1st Alpha waves
are denoted by the dark blue lines.
This is the price range that a security will normally move to
once the price of the Alpha Trend line is crossed in either direction.
Next are the 2nd Alpha waves which are denoted by the light blue lines. It is this area between the 2nd Alpha waves
where 79.82% of the time a security's price will remain. Last
are the 3rd Alpha waves which are denoted by the violet lines. Once a security's price reaches this
area it is in an extreme overbought/oversold condition. A security
can stay in this area for awhile, but this usually represents
a poor price in which to place a trade in the prevailing trend.
The next three moving averages
are the one year moving average of the Alpha Trend denoted by
the
bold violet line, the
five year moving average of the Alpha Trend denoted by the bold green line, and the ten year moving average of
the Alpha Trend denoted by the bold black line. Each of
these moving averages is set for the different time frames of
a chart. On the daily chart the one year moving is 240 days,
the five year is 1200 days and the ten year is 2400 days. On
the weekly charts the one year moving average is 52 weeks, the
five year moving average is 260 weeks and the ten year moving
average is 520 weeks. Lastly, for the monthly charts the one
year moving average is 12 months, the five year moving average
is 60 months and the ten year moving average is 120 months.
In the upper window is my own
relative strength indicator denoted by the bold blue line. This indicator measure the strength of the
trend, "0" is overbought and "-100" is oversold.
This indicator measures the strength of the price movement between
the 3rd
Alpha waves.
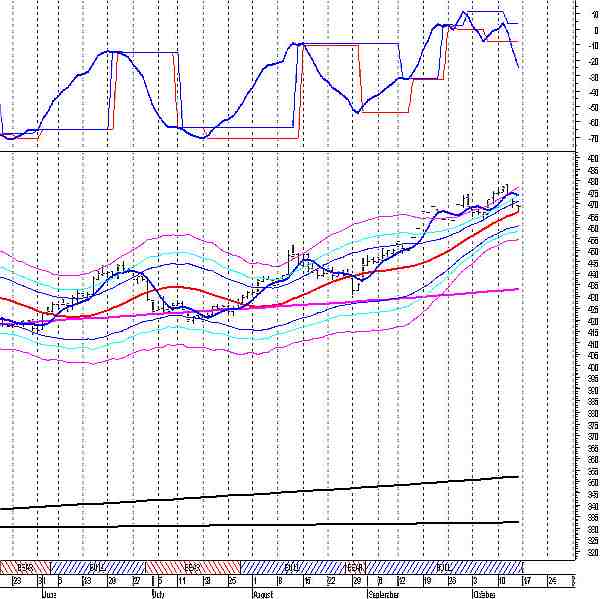 Above is the
daily chart for Gold. Above is the
daily chart for Gold.
The current position for gold
is short. The current sell price is $467.11. The Current trend
is bullish. The Alpha Trend is trending up. Today's closing price
is 0.58 percent to the support price of Alpha Trend. The Alpha
Trend Support price is $466.47.
The one year moving average
of the Alpha Trend is trending up. Today's closing price is 8.27
percent to the support price of the one year moving average of
the Alpha Trend.
The one year moving average
of the Alpha Trend Support price is $433.34. The relative strength
indicator is trending down. Gold is moving down from an extreme
over brought condition, the relative strength indicator had been
above zero which is a very over brought area. Gold is currently
only 0.58% from the Alpha Trend line which has held since August
31, 2005. If Gold can not hold above the Alpha Trend support
price we should see a fall to the lower 1st Alpha wave band support
price of $460.46. On the daily chart gold has had a great run
from the end of August; the best thing for gold at this point
is to start building a new base around the Alpha Trend line and the lower 1st Alpha wave band. Since February of this year Gold
has been pulling back to only the lower 1st Alpha wave band then rallying to new highs. The only
concern I have is if Gold falls below the bottom 3rd Alpha wave price of $454.44 level and the relative
strength indicator does not turn up we could see a major drop
in Gold to the one year moving average of the Alpha Trend currently
at $433.34.
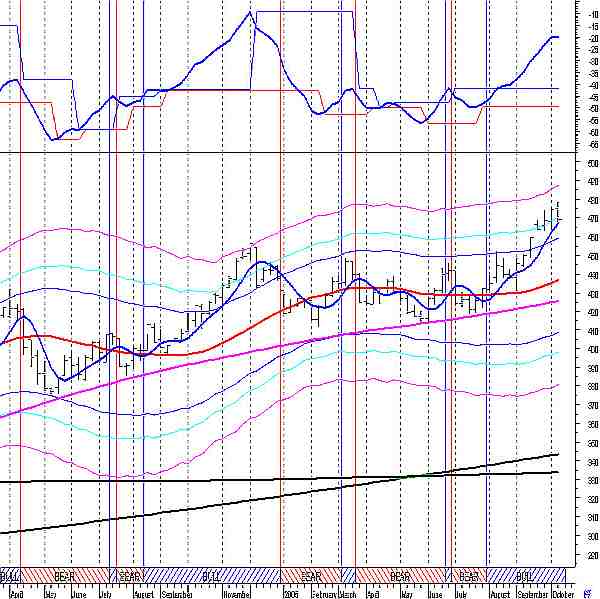 Above is the weekly
chart for Gold.
Above is the weekly
chart for Gold.
The current weekly position
for Gold is long. The current sell price is 478.3150. The Current trend is bullish. The
Alpha Trend is trending up. Today's closing price is 7.4297 percent
to the support price of Alpha Trend. The Alpha Trend Support
price is 436.7506.
The one year moving average
of the Alpha Trend is trending up. Today's closing price is 10.2719
percent to the support price of the one year moving average of
the Alpha Trend.
The one year moving average
of the Alpha Trend Support price is 425.4938. The relative strength
indicator is trending up. The weekly chart of Gold is very interesting
in that it is saying that this bull market that began in mid
July still has some strength to it. The relative strength indicator
is stilling moving higher however its rise has slowed. Also,
Gold's low for the week pulled back to within ten cents of the
shorter term Alpha trend support price of $467.10, then rallied
back up again. Gold has been holding around the upper 2nd Alpha wave band. For this to be a mid term top in
Gold the relative strength indicator will have to turn down and
we will need to see a break below the upper 1st Alpha wave band of price of $459.24. Until this occurs
Gold should hold in this price area or advance towards the upper
3rd
Alpha wave price of
$487.
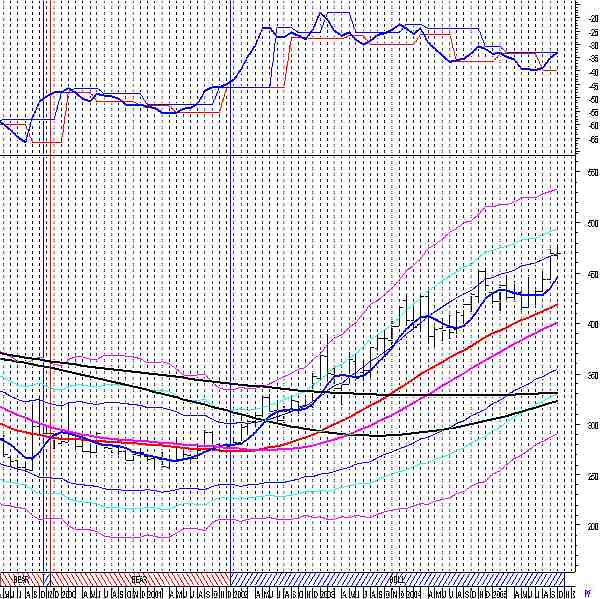 Above is the
monthly chart for Gold. Above is the
monthly chart for Gold.
The current trend is bullish.
The Alpha Trend is trending up. Today's closing price is 12.1338
percent to the support price of Alpha Trend. The Alpha Trend
Support price is 418.4286. The one year moving average of the
Alpha Trend is trending up.
Today's closing price is 16.9919
percent to the support price of the one year moving average of
the Alpha Trend. The one year moving average of the Alpha Trend
Support price is 401.0534. The relative strength indicator is
trending up. The monthly chart is pointing to a continuing rise
in Gold. This current bull market, which started in December,
2001, is not showing any signs that it is over. The relative
strength indicator has moved above its previous reversal price
level set back in February of this year. This coupled with the
fact that Gold has held around the upper 1st Alpha wave band, is pointing to rise in Gold to the
next resistance price area of $493 an ounce.
In conclusion the daily chart
for Gold is showing weakness with a pullback to the price area
of $460.46-$466.47 range. If Gold can hold this price and rally
the weekly resistance price area of $487 is the next major huddle
Gold needs to get above. Even if Gold does pullback to the next
major support price range of $433- $436 this would represent
an excellent opportunity to get back into Gold for the next rise.
Oct 15, 2005
Erich K. Soltes
Alpha Trend Analysis
email: erich@alphatrendanalysis.com
Alpha Trend Analysis
About Erich
Soltes
A graduate of
Brookfield High School in Brookfield CT and an Eagle Scout, Erich
went on to graduate from SUNY Maritime College in New York City
in 1988, with a BS in Marine Transportation and a minor in Economics.
For the next ten years he was a Navel Reserve officer and a Merchant
Marine officer. In 1998 he went to work on Wall Street obtaining
his series 7, 63 and 65 licenses. He worked both as a stockbroker
and a financial planner helping clients obtain their financial
goals. In 2004 he was able to finally reach his goal of developing
a mathematical trading model that could beat the "buy and
hold" method of investing. In mid 2005 the Alpha Trend Analysis
website was created.
For more information
on the Alpha Trend System and the daily newsletter please
go to alphatrendanalysis.com.
DISCLOSURE: Erich K. Soltes is
the Owner of Alpha Trend Analysis, which contains the opinions
of E. K. Soltes, and is provided for informational purposes only.
Neither Erich Soltes nor Alpha Trend Analysis, provide individual
investment advice and will not advise you personally concerning
the nature, potential, or value of any particular stock or investment
strategy. To the extent that any of the information contained
in this article may be deemed investment advice, such information
is impersonal and not tailored to the investment needs of any
specific person. Past results of Alpha Trend Analysis, or E. K.
Soltes are not necessarily indicative of future performance. Erich
Soltes, entities that he controls, family, and associates, may
have positions in securities mentioned in this article and may
close them at any time.
Alpha Trend
Analysis does not represent the accuracy, nor does it warranty
the accuracy, completeness or timeliness of the statements made
on its web site or in its email alerts. The information provided
should therefore be used as a basis for continued, independent
research into a security referenced in this article so that the
Subscriber forms his or her own opinion regarding any investment
in a security mentioned in it. The Subscriber therefore agrees
that he or she alone bears complete responsibility for his or
her own investment research and decisions. We are not and do not
represent ourselves to be a registered investment adviser, or
advisory firm or company. You should consult a qualified financial
advisor or broker before making any investment decision and to
help you evaluate any information you may receive from this article.
Consequently,
the Subscriber understands and agrees that by using any of Alpha
Trend Analysis services, either directly or indirectly, Alpha
Trend Analysis shall not be liable to anyone for any loss, injury
or damage resulting from the use of, or information attained from
Alpha Trend Analysis or any of its services.
Recent Gold/Silver/$$$ essays at 321gold:
Jul 07 Gold: Buy Here & Forego Fear Stewart Thomson 321gold
Jul 06 Metalsource Adds Acres and Ounces at Silver Hill in NC Bob Moriarty 321gold
Jul 05 Oil, Silver & Gold: The Bulls Take Charge captainewave 321gold
Jul 03 White Gold Moves to Spin Out Critical Metals in Yukon Bob Moriarty 321gold
Jul 03 Gold, Silver, & Miners: Rally Time Morris Hubbartt 321gold
Jul 03 L@@K Amazon Kindle and Paperback Books by... Bob Moriarty 321gold
|
321gold Inc

|
