Alpha Trend Analysis of Gold
Futures
Erich K. Soltes
Sep 13, 2005
This report will examine Gold
Futures on a daily, weekly and monthly basis. A technical analysis
for each chart will be presented with explanation on where the
security is currently and what needs to occur to maintain the
current position. Additionally, long term and short term support
and resistance price will be provided.
First a little background information on the Alpha Trend Analysis
system. This system has been in development for almost 15 years.
The Alpha Trend is the primary trend line that I created. It
is an adaptive moving average using trigonometric functions.
It is from this primary trend line from which all other formulas
are derived. There are six moving average trend lines that are
used to analyze a security. The short term indicators are upper
and lower bands; these are 2 days in length. The mid term indicator
is the Alpha Trend, indicated by the bold red line, which is
several weeks in length. Lastly are, the one year moving average
which is red colored, the five year moving average which is bright
green colored and the ten year moving average which is black
colored, of the Alpha Trend. In addition to the moving averages
there are six wave bands.
These wave bands are called
Alpha Trend Wave bands they are Fibonacci advance and retracement
of the Alpha Trend. The chart contains two windows. The
top window indicates whether the current position is long, short
or neutral. A long position is indicated by one (1), a short
position is indicated by a negative one (-1) and a neutral position
is indicated by a zero (0). The bottom window contains the securities
information along with the six moving averages. At the very bottom
of the chart the primary trend of either bullish or bearish is
indicated.
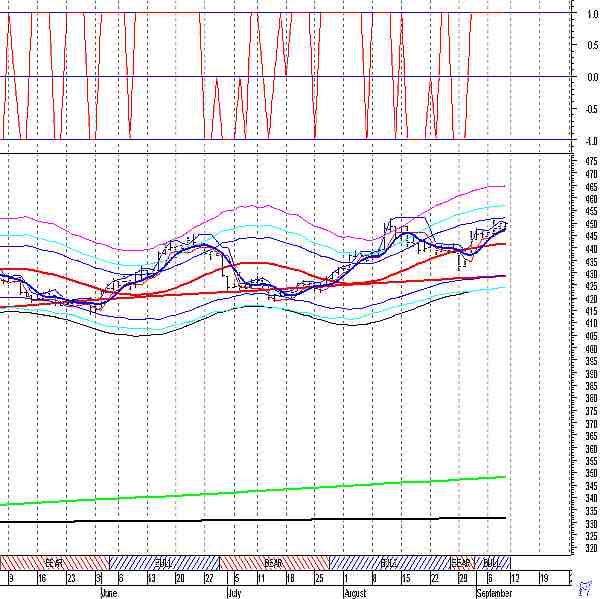
Above is the Daily chart for
Gold Futures.
The current position for gold is long with a current sell price
of 450.31. The current trend of Gold is bullish with the Alpha
Trend trending up. Friday's closing price is 1.8719 percent above
the Alpha Trend Support price of 441.7312. The one year moving
average of the Alpha Trend is trending up. Friday's closing price
is 4.9046 percent above the one year moving average of the Alpha
Trend support price of 428.9613. For the last few days Gold has
been approaching the upper band of the 1st Alpha Trend Wave resistance
price of $452.12. The 1st Alpha Trend Wave is rolling over if
Gold can not break through this resistance price we should see
a pullback to the Alpha Trend support price of 441.7312.
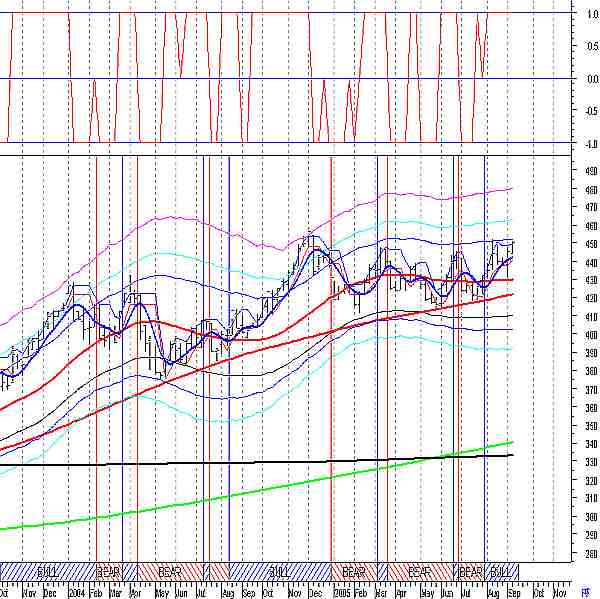
Above is the Weekly chart for
Gold Futures.
The current position for Gold is long and the current trend for
Gold is bullish. The Alpha Trend is trending up with Friday's
closing price 4.6451 percent the Alpha Trend Support price of
430.0247. The one year moving average of the Alpha Trend is trending
up with Friday's closing price 6.6401 percent above the one year
moving average of the Alpha Trend support price of 421.9800.
On the weekly chart Gold is approaching the 1st Alpha Trend Wave
resistance price of 452.225. Just as on the daily chart Gold
should be topping out at this resistance price and Gold should
pullback to the Alpha Trend support price 430.02. On the weekly
chart gold has held above the one year moving average of the
Alpha Trend since mid - August of 2001. This trend line is a
major support line currently at 421.98. If Gold is topping out
and the Alpha Trend doesn't hold Gold should hold above 421.98
support price.
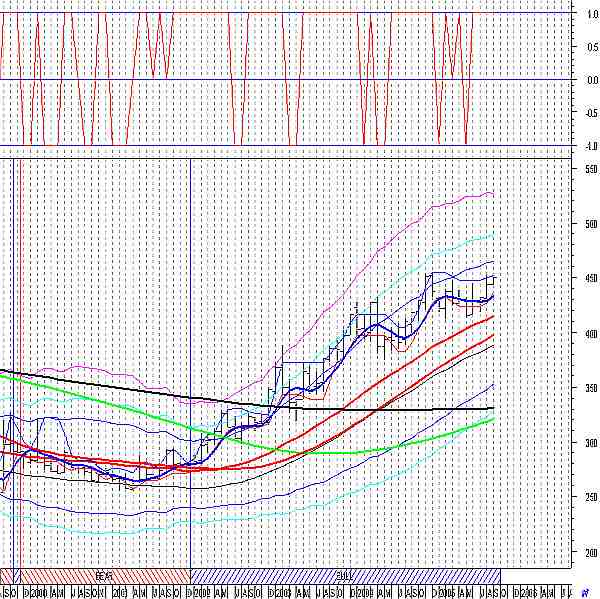
Above is the Monthly chart
for Gold Futures.
The current position is long and the current trend is bullish.
The Alpha Trend is trending up with Friday's closing price 8.4361
percent above the Alpha Trend Support price of 414.9908. The
one year moving average of the Alpha Trend is trending up with
Friday's closing price, 13.1797 percent above the support price
of the one year moving average of the Alpha Trend of 397.5978.
Gold has held above the Alpha Trend since December 31, 2001 this
trend line is a major support line currently at 414.99.
In conclusion, Gold has been in a major bull market since the
end of 2001. For those who watch Gold on a daily basis it has
been a madding slow bull market, however this does imply that
this market has much far to go. When the Gold market is viewed
on a weekly and monthly chart the bull market is apparent and
the support prices have held for years. Gold does appear to be
topping in the short term, the first support price is 441.73
after that next support price range is 421.98 - 430.02 this price
range is from both the daily and weekly charts.
Erich K. Soltes
email: erich@alphatrendanalysis.com
Alpha Trend Analysis
About Erich
Soltes
A graduate of
Brookfield High School in Brookfield CT and an Eagle Scout, Erich
went on to graduate from SUNY Maritime College in New York City
in 1988, with a BS in Marine Transportation and a minor in Economics.
For the next ten years he was a Navel Reserve officer and a Merchant
Marine officer. In 1998 he went to work on Wall Street obtaining
his series 7, 63 and 65 licenses. He worked both as a stockbroker
and a financial planner helping clients obtain their financial
goals. In 2004 he was able to finally reach his goal of developing
a mathematical trading model that could beat the "buy and
hold" method of investing. In mid 2005 the Alpha Trend Analysis
website was created.
For more information
on the Alpha Trend System and the daily newsletter please
go to alphatrendanalysis.com.
DISCLOSURE: Erich K. Soltes is
the Owner of Alpha Trend Analysis, which contains the opinions
of E. K. Soltes, and is provided for informational purposes only.
Neither Erich Soltes nor Alpha Trend Analysis, provide individual
investment advice and will not advise you personally concerning
the nature, potential, or value of any particular stock or investment
strategy. To the extent that any of the information contained
in this article may be deemed investment advice, such information
is impersonal and not tailored to the investment needs of any
specific person. Past results of Alpha Trend Analysis, or E. K.
Soltes are not necessarily indicative of future performance. Erich
Soltes, entities that he controls, family, and associates, may
have positions in securities mentioned in this article and may
close them at any time.
Alpha Trend
Analysis does not represent the accuracy, nor does it warranty
the accuracy, completeness or timeliness of the statements made
on its web site or in its email alerts. The information provided
should therefore be used as a basis for continued, independent
research into a security referenced in this article so that the
Subscriber forms his or her own opinion regarding any investment
in a security mentioned in it. The Subscriber therefore agrees
that he or she alone bears complete responsibility for his or
her own investment research and decisions. We are not and do not
represent ourselves to be a registered investment adviser, or
advisory firm or company. You should consult a qualified financial
advisor or broker before making any investment decision and to
help you evaluate any information you may receive from this article.
Consequently,
the Subscriber understands and agrees that by using any of Alpha
Trend Analysis services, either directly or indirectly, Alpha
Trend Analysis shall not be liable to anyone for any loss, injury
or damage resulting from the use of, or information attained from
Alpha Trend Analysis or any of its services.
Recent Gold/Silver/$$$ essays at 321gold:
Jul 22 Is Wall Street Looking at the Wrong Chart? Carlton Preston 321gold
Jul 21 A Government Disease & A Golden Cure Stewart Thomson 321gold
Jul 19 Oil, Stk Mkt & Silver: Key Wave Counts captainewave 321gold
Jul 17 "Gold, Food, & Energy" - Key Sectors In Play Morris Hubbartt 321gold
Jul 17 Gold Stocks' Autumn Rally '26 Adam Hamilton 321gold
Jul 14 Gold Bugs Versus Mainstream Narrators Stewart Thomson 321gold
|
321gold Inc

|
