Inflation Update
Steve Saville
email: sas888_hk@yahoo.com
Dec 28, 2010
Below is an excerpt from a commentary originally posted at www.speculative-investor.com on 19th December, 2010.
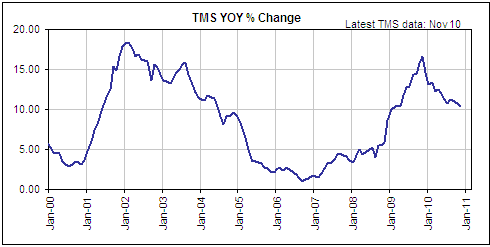
TMS (True Money Supply) Status
Michael Pollaro's blog is the best place on the Web to keep in touch with what's happening to the money supply.
We do our own calculation of US money supply (TMS), which is almost identical to the TMS2 calculation at the above-linked blog. There are some differences between the year-over-year TMS growth rates that we come up with and those determined by Mike Pollaro, but the differences are immaterial (our calculation is undoubtedly less accurate, but the discrepancy is almost always limited to a few tenths of a percentage point).
Despite what Bernanke claims, the US money supply continues to grow at a rapid rate. As evidence we present the following chart, which shows that TMS's year-over-year growth rate is above 10% and has been in double digits for almost two years.
By the way, we don't think that Bernanke is lying when he says that the US money supply hasn't grown by much over the past 1-2 years. The problem, we suspect, is that he doesn't know how to measure the money supply, which is possibly worse for the US economy than if he understood what was going on but was deliberately hiding the truth. If he knew there was a monetary inflation problem, but was lying about it, there would be a chance of corrective measures being implemented sooner rather than later. Instead, he feels comfortable promoting more monetary inflation because he truly believes that the current inflation rate is low.
More Inflation-Adjusted Charts
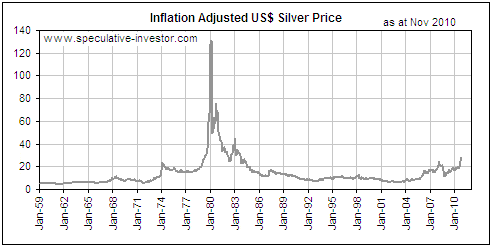
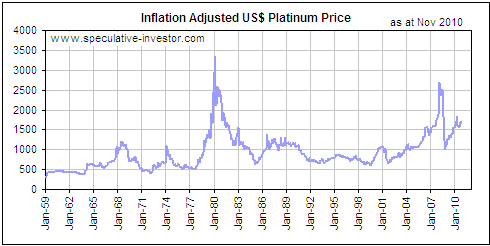
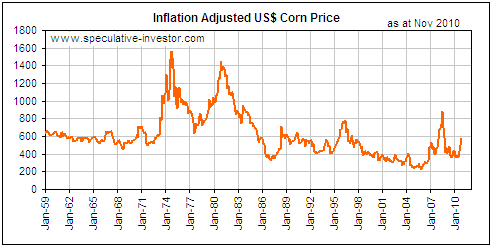
Last week we discussed a method of adjusting for the effects of inflation that doesn't rely on the flawed price-index concept, and showed inflation-adjusted (IA) charts of oil, copper and gold. Here are some more charts that employ the same method of inflation adjustment to illustrate real performance. Each of these charts shows monthly performance from January-1959 through to November-2010, with prices expressed in current (November-2010) dollars.
1. Silver's long-term IA performance has been distorted by the 1979 moon-shot in its price that occurred in response to the escapades of the Hunt brothers. We doubt that it will ever again reach its January-1980 height in real terms, but, like gold, it stands a good chance of making considerable real progress over the years ahead.
2. Platinum's long-term IA chart looks similar to that of oil, although oil made a new all-time high in real terms in 2008 whereas platinum did not.
Our guess is that the IA platinum price made a long-term peak in 2008, but strength in gold and silver could result in platinum testing its 2008 IA high within the next few years.
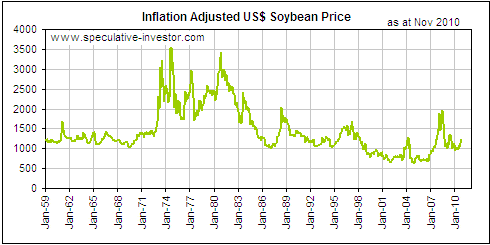
3. The IA charts displayed below reveal that in real terms, corn and soybeans are trading at roughly the same price today as they did throughout much of the 1960s. This tells us that the large increase in demand over the past 50 years has been met by an equally large increase in farm productivity.
Due to a) their relative cheapness in real terms, b) the possibility that farm productivity won't continue to improve at the same rate, and c) the risks to supply that are posed by natural disasters and policy errors (unnatural disasters), the grains could be good inflation hedges over the next several years.
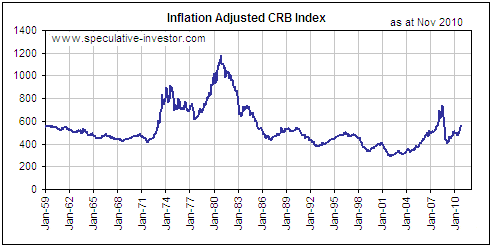
4. The last of our long-term IA charts puts the so-called "commodity supercycle" into perspective. Perhaps it will evolve into something that justifies the "supercycle" moniker, but at this stage it looks like a fairly normal cycle.
Note: We used the CCI (Continuous Commodity Index) to create the following chart.
###
Steve Saville
 email: sas888_hk@yahoo.com email: sas888_hk@yahoo.com
Hong Kong Regular financial market forecasts and analyses are provided at our web site:
http://www.speculative-investor.com/new/index.html. We aren't offering a free trial subscription at this time, but free samples of our work (excerpts from our regular commentaries) can be viewed at: http://tsi-blog.com
Copyright ©2002-2019 speculative-investor.com All Rights Reserved. Saville Archives
321gold Ltd

|
