Inflation and the “Commodity Supercycle”
Steve Saville
email: sas888_hk@yahoo.com
Dec 15, 2010
Below is an excerpt from a commentary originally posted at www.speculative-investor.com on 12th December, 2010.
Our view is, and has always been, that the rapid economic growth occurring in countries such as China and India is NOT the primary driver of the long-term bull market in commodities that is often referred to as the "commodity supercycle". Instead, we see the bull market as mostly an effect of inflation, where inflation is defined as an expansion of the money supply. One of the consequences of inflation is a reduction in the value of money relative to some of the things that money can buy.
We'll endeavour to support our view using some inflation-adjusted charts, but before doing so we should explain the method we've used to adjust for the EFFECTS of inflation. We emphasised "effects" in the preceding sentence because what we want to adjust for is the loss of purchasing power (PP) that eventually results from monetary inflation, not the monetary inflation itself.
Of course, the most popular way of adjusting for the effects of inflation is to use official price indices such as the CPI or the PPI. However, this way of doing the adjustment is all but guaranteed to arrive at a bogus result, and not just because the government does its best to understate the currency's loss of PP. We would also end up with a bogus result if we were to use the price indices calculated by Shadow Government Statistics. The reason is that all such indices are based on a false concept, which is that you can come up with a single number that represents the average economy-wide price level by adding together, once per month, the prices of a "representative sample" of the things that are traded within the economy. The reality is that disparate items* cannot be added together in a way that produces a sensible result. Furthermore, it isn't possible to come up with a representative sample that will consistently reflect what's happening to prices across the entire economy.
Although price data cannot be used to determine a number that consistently paints an accurate picture of the change in a currency's PP, the situation isn't hopeless. This is because we can apply economic theory to deduce an estimated change in PP that stands a good chance of being roughly correct over the long term.
The theory that we will apply can be summarised as follows: The percentage reduction in a currency's purchasing power should, over the long-term, be roughly equal to the percentage increase in its supply minus the percentage increase in the combination of population and productivity. For the purpose of this exercise, we will assume that the average annual increase in the combination of US population and productivity has been 3% over the past 50 years (population growth has averaged 1.1%/year over this period, so we are making the assumption that productivity growth has averaged 1.9%/year), which amounts to an average of 0.25%/month. Based on this assumption we can deduce a monthly inflation adjustment by subtracting 0.25% from the month-to-month percentage increase in TMS (True Money Supply). During any given month or any given year the inflation adjustment estimated using this method will likely be wrong (due mostly to the long and variable delays from a change in money supply to the associated change in PP), but it should be approximately correct over periods of 7 years or more. It is therefore a big improvement over the price index approach, which is all but guaranteed to be totally wrong over the long-term.
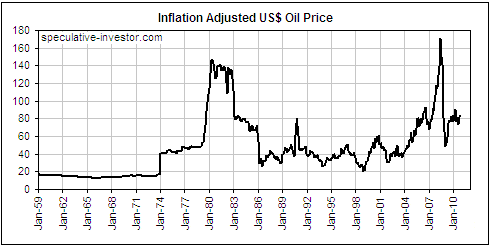
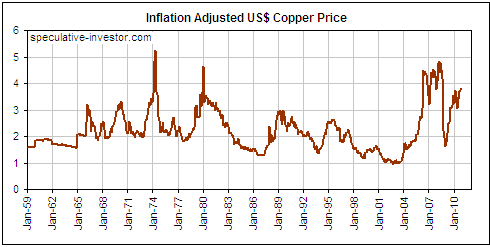
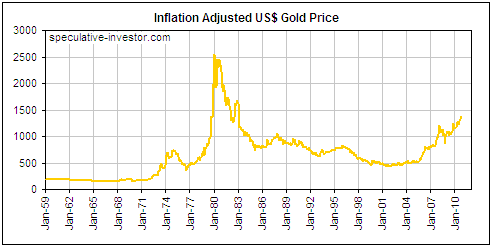
We now turn to the charts mentioned in the second paragraph. These charts show the real performances, in current US$ terms, of oil, copper and gold since 1959, with adjustments for inflation having been made using the method described above.
Here's what the charts tell us:
1. In real terms, the 1973-1980 and 2001-2008 rises in the oil price were similar. The inflation-adjusted (IA) oil price exceeded its 1980 high in 2008, but not by much and not for long. As things currently stand, the IA oil price is near its average of the past 35 years, which contradicts the notion that the combination of "Peak Oil" and "Chindia's" growth is behind oil's upward re-rating.
2. In real terms, copper has spent the past 50 years oscillating between $1 and $5. There appears to be no meaningful difference between the inflation-fueled rise of 2003-2008 and the inflation-fueled rise of the 1970s.
3. The inflation-adjusted gold price has been rising steadily over the past several years, but is still a long way below its 1980 peak (in today's dollars, the 1980 peak is around $2500/ounce). Interestingly, but from our perspective not surprisingly, the IA prices of oil and copper collapsed in response to the 2008 financial crisis and have since only partially recovered, whereas the IA gold price experienced a fairly normal correction in 2008 and then resumed its bull market.
The main reason that gold has continued to make real progress since mid 2008 is that the bulk of the world's gold supply is held for store-of-value purposes, with only a tiny fraction being consumed in industrial processes. A consequence is that the demand for gold rises as other perceived stores of value are discredited. When the credibility of central banks and the currencies they manage began to shrink at an accelerated pace during 2008, a sizeable increase in the total demand for gold was a natural consequence.
If our economic outlook is in the right ballpark then gold will continue to make new multi-decade highs in real (inflation-adjusted) terms over the years ahead, whereas secular peaks were probably put in place for the inflation-adjusted prices of oil and copper in 2008.
To wrap up, what we've had over the past decade has been the strange combination of persistently high monetary inflation and persistently low inflation fears, prompting many analysts to look for non-inflation-related explanations for the large rises in commodity prices. The charts presented above show that significant real gains were made, but that these gains were not unprecedented and probably had more to do with the extreme cheapness of commodities in the early 2000's than with the popular theories about "Peak Oil" and the "Asian economic growth miracle".
*Because all the items involved in the calculation are prices it could appear as if they are not disparate. The problem can be quickly seen, however, if we attempt to take an average of what a dollar buys in different transactions, rather than an average of how many dollars are used in different transactions. For example, consider three transactions. In the first, one dollar is paid for a potato. In the second, an amount of two hundred dollars is paid for a medical examination. And in the third, a forty-thousand-dollar payment is made for a new car. What we can say, then, is that in the first transaction one dollar buys 1 potato, and in the second and third transactions it buys 1/200th of a medical exam and 1/40,000th of a car. What is the average of 1 potato, 1/200th of a visit to the doctor and 1/40,000th of a car? The statisticians that calculate consumer price indices claim to know the answer.
###
Steve Saville
 email: sas888_hk@yahoo.com email: sas888_hk@yahoo.com
Hong Kong Regular financial market forecasts and analyses are provided at our web site:
http://www.speculative-investor.com/new/index.html. We aren't offering a free trial subscription at this time, but free samples of our work (excerpts from our regular commentaries) can be viewed at: http://tsi-blog.com
Copyright ©2002-2019 speculative-investor.com All Rights Reserved. Saville Archives
321gold Ltd

|
