|
|||
HUI - Updated Price TargetsPMtrader This paper builds upon several prior editorials, the most recent of which was titled, "HUI - Where to Now?" An index of these editorials may be found here. In the referenced editorial, I boldly claimed that the HUI would reach 425 by April 20, 2006 - with associated caveats... after all, the markets are simply a study in probability. With ten trading days remaining until this target, I thought it was time to revisit the analysis and see where we stood. I fine-tuned the graphs based on both new data and a more accurate drawing of the trend lines. Well... there is some good news and some bad news... first, the bad news. The bad news is that the 425 target for April 20 has slipped to a lower probability. The good news is two-fold. The bullish targets were proposed at a time when many were screaming "correction, correction, correction." But as is evident, the bullish view was vindicated with the HUI setting two consecutive all-time weekly closing highs, and an all-time daily closing high just this week... only the monthly high close is left and April looks set to achieve this goal. But there is more good news. The HUI now shows higher price targets, 460 and 475, though the timing has been pushed out. Let's dig in and look at some of the data that supports the preceding conclusions. 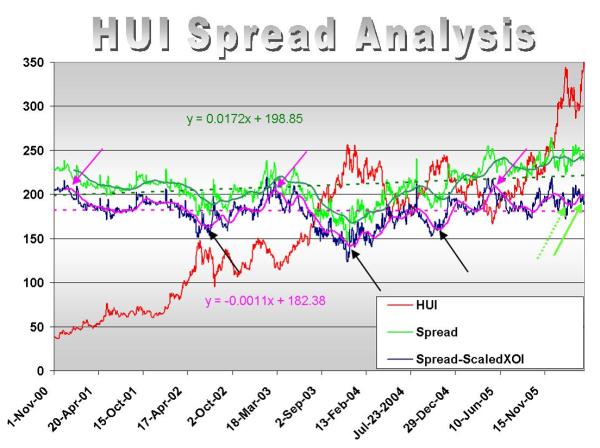 Please refer to the prior referenced editorial for a detailed explanation of the purple and black arrows, as well as many of the other features of the plot above. For purposes of this discussion, only a few things need to be emphasized. First, remember that the solid purple line is the 50 day moving average (dma) of the "new" spread - the one that includes an oil proxy. This indicator has been powerful in predicting major buy and sell points since December of 2000... the onset of this golden bull. Now, notice the green arrows at the right of the plot above. The dotted green arrow shows the point in time when the prior editorial, "HUI - Where to Now?", was written. In particular, it was logical to assume at that time that the 50 dma of the spread (solid purple line) would continue below the linear trend line (dotted purple line), and thus create a new sell point after a major run-up. However, the 50 dma turned back into buy territory and has yet to approach the trend line in any meaningful way. If history is a guide, this indicator is saying that there are still several months to run before any meaningful correction in the HUI begins. 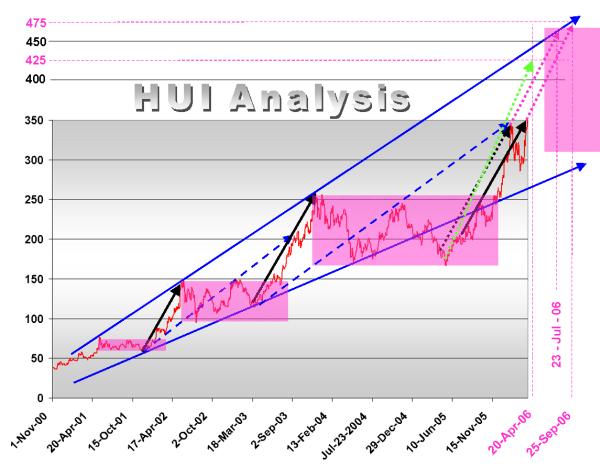 The plot above is similar to the one presented in the last editorial with a few notable changes. It includes the market data from the interim, it more accurately draws the trend lines, and it provides new targets. The green dotted arrow was the price target projection from the last paper. Though this target could be achieved, it seems less likely than the two new price continuations given by the dotted and solid purple arrows at the upper right. Note also that we tried to surmise the new region of volatility - this is shown by the top-most purple-shaded rectangle at the upper-right of the plot. It is unlikely that this will be exact, however it may provide some guidance for price behavior going forward - especially for the intermediate term trader. In conclusion, though the HUI target of 425 by April 20, 2006 has slipped in probability, other higher targets seem likely. In particular, the 460 to 475 region for the HUI within the next 4 to 5 months are probable. All the best, April 10, 2006 |


 About Terry L. Krohn