|
|||
HUI - Where to Now?PMtrader This paper builds upon several prior editorials. In the more recent of the latter editorials, a price target of 350 HUI and $550 spot gold was proposed. Now that these targets have been reached, an obvious question arises: Where to now? Let's not beat around the bush. The next target for the HUI is 425, which should be reached by April 20, 06. Now let's digress a moment and discuss exactly how to interpret this admittedly bold statement. Is it investment advice? No. Is it an absolute truth? No... rather it is a conclusion drawn from the analysis below. Additionally, it is this author's interpretation of what he feels is the highest probability outcome for medium term HUI performance. So with the latter said, let's dig in to some of the technicals that tend to support the aforementioned targets. First let's reiterate a fundamental. Over the past many months, we've had dramatically increasing oil prices. Since the profits from gold mining are significantly reduced by higher energy costs, it is reasonable to suppose that the price of oil would have a noticeable impact on the prior spread analysis. In this essay, the oil price is considered in the standard spread analysis (Price of Gold minus the HUI Index). In particular, a scaled value for the XOI is used as a proxy for the oil effect, and this proxy is subtracted from the standard spread. One might credibly argue that a more pure proxy for the oil price would be better. However, we must keep in mind that the HUI appears in the formula as well - implying that an index such as the XOI may provide reasonable or even superior results. The reader must judge the efficacy of this proxy based on the results shown below. 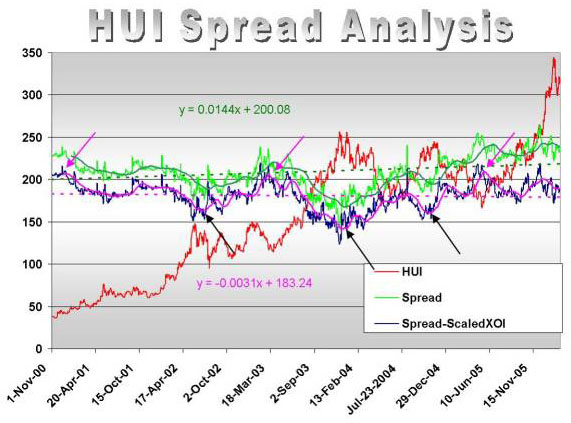 Notice first that a linear trend line (dotted) has been added for the standard spread as well as the "new spread" (standard spread - scaled XOI). Ideally, for spread analysis these linear trends should be flat (the x-coefficient should be zero). Looking at the two algebraic formulas shown in the figure, it is clear that the new trend is much more "efficient" in achieving the flat-line performance - implying we could well be on the right track! So let's focus on the 50 day moving average (dma) of the new spread as indicated by the purple line in the plot. Notice the three places this purple line peaked above the 200 mark as indicated by the three purple arrows. These occurred approximately in January of 2001, April of 2003, and July of 2005. There are a few things to notice: They are equally spaced and 27 (3 cubed for the algebraists) months apart; they arguably coincide with the best buy points in the bull market in gold, which started in December of 2000; and the most recent one just occurred in July of this year! Now notice the black arrows, which coincide with some of the best sell points in this bull market (for intermediate to longer term swing traders). A question arises: Many technical analysts have recently been calling for a top in the HUI... so where is the sell signal from this spread analysis? There is no current sell signal in the HUI spread analysis! In fact, it looks like the 50 dma of the spread has months to run before a sell signal will be given. Does this have to unfold this way? No... but I must present the analysis based on what I consider to be the high probability case. Alright, so far we've concluded that the HUI may have some months to run before a local top is in. Now, what about price and time targets? 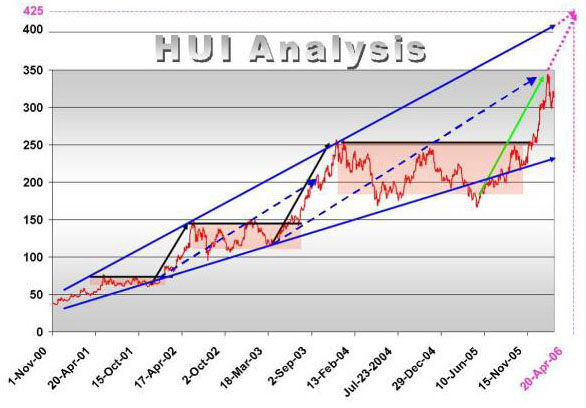 Most of the plot above is self-explanatory, but there are a few subtleties worth emphasizing. Note the red transparent boxes, which show regions of consolidation and price volatility. These regions are great for the astute trader, but painful for those who are simply holding tight and riding this bull in the gold and silver markets. At the end of these regions of volatility are sharp run-ups characterized by the break out from the consolidation regions - these run-ups represent time periods where trading becomes problematic! So another question arises: Which region is on the horizon? The truth is that nobody can answer this with absolute certainty. However, scrutinizing the dashed blue lines may give the required clue. According to the seemingly obvious trend continuations given by the purple dotted arrows and lines, the next target for the HUI is 425, which should be reached by April 20, 06. All the best, |


 About Terry L. Krohn