 Special SKI Report #246 Special SKI Report #246
Gold Stock Update: Precision Jeffrey M. Kern, Ph.D.
Email: jeff@skigoldstocks.com
USERX | historicals
Written Sunday Dec 6, 2020
Published Dec 7, 2020 Current USERX price = 12.98, Down 28 cents (2.1%) since the last report 3 weeks ago. Introduction (repeated from prior Reports):
I have been using my unique SKI indices
to predict price changes in the precious metals' market for more
than two decades. And my indices continue to mark the critical
points. I have initiated a subscription website since 1/13/06
(yes, Friday the 13th) after having posted free updates for years
at www.321gold.com. SKI is a timing service; although
almost everyone seems to believe that market timing is impossible,
that IS what the SKI indices have done for 36 years.
The SKI indices contain short-term (16-20
trading days), intermediate-term (35-39 trading days), and long-term
(92-96 trading days) indices. A more comprehensive description
of these mathematical indices and their history is found here.
Basically, the indices compare today's price to prices from a
specified prior time period. The name of the index specifies the
time period (e.g., 92-96 index = compare today's price to prices
from 96, 95, 94, 93, and 92 trading days earlier). Although I
use the oldest gold mutual fund, USERX, for analyses, the predictions
are applicable to the broad precious metals' market. I do not
recommend or analyze specific stocks, but my subscribers from
around the world regularly discuss individual issues on our Forum.
In addition to the truly unique SKI indices, I also use "run
patterns" to guesstimate turning points in the precious metals'
market. A "run" refers to a pattern of daily up and
down market closing prices. If the market has 3 consecutive days
of higher closing prices, the run is "3 up". If prices
then decline for 2 consecutive days, the run becomes "3 up
and 2 down". If prices then close higher the next day, the
run changes to "2 down and 1 up". Some people have referred
to run patterns as "worms". A run pattern is only completed
after the direction of closing prices has changed. I have compiled
a listing of every run pattern that has ever occurred and generated
probabilities that the end of the run marks a high or a low, moderated
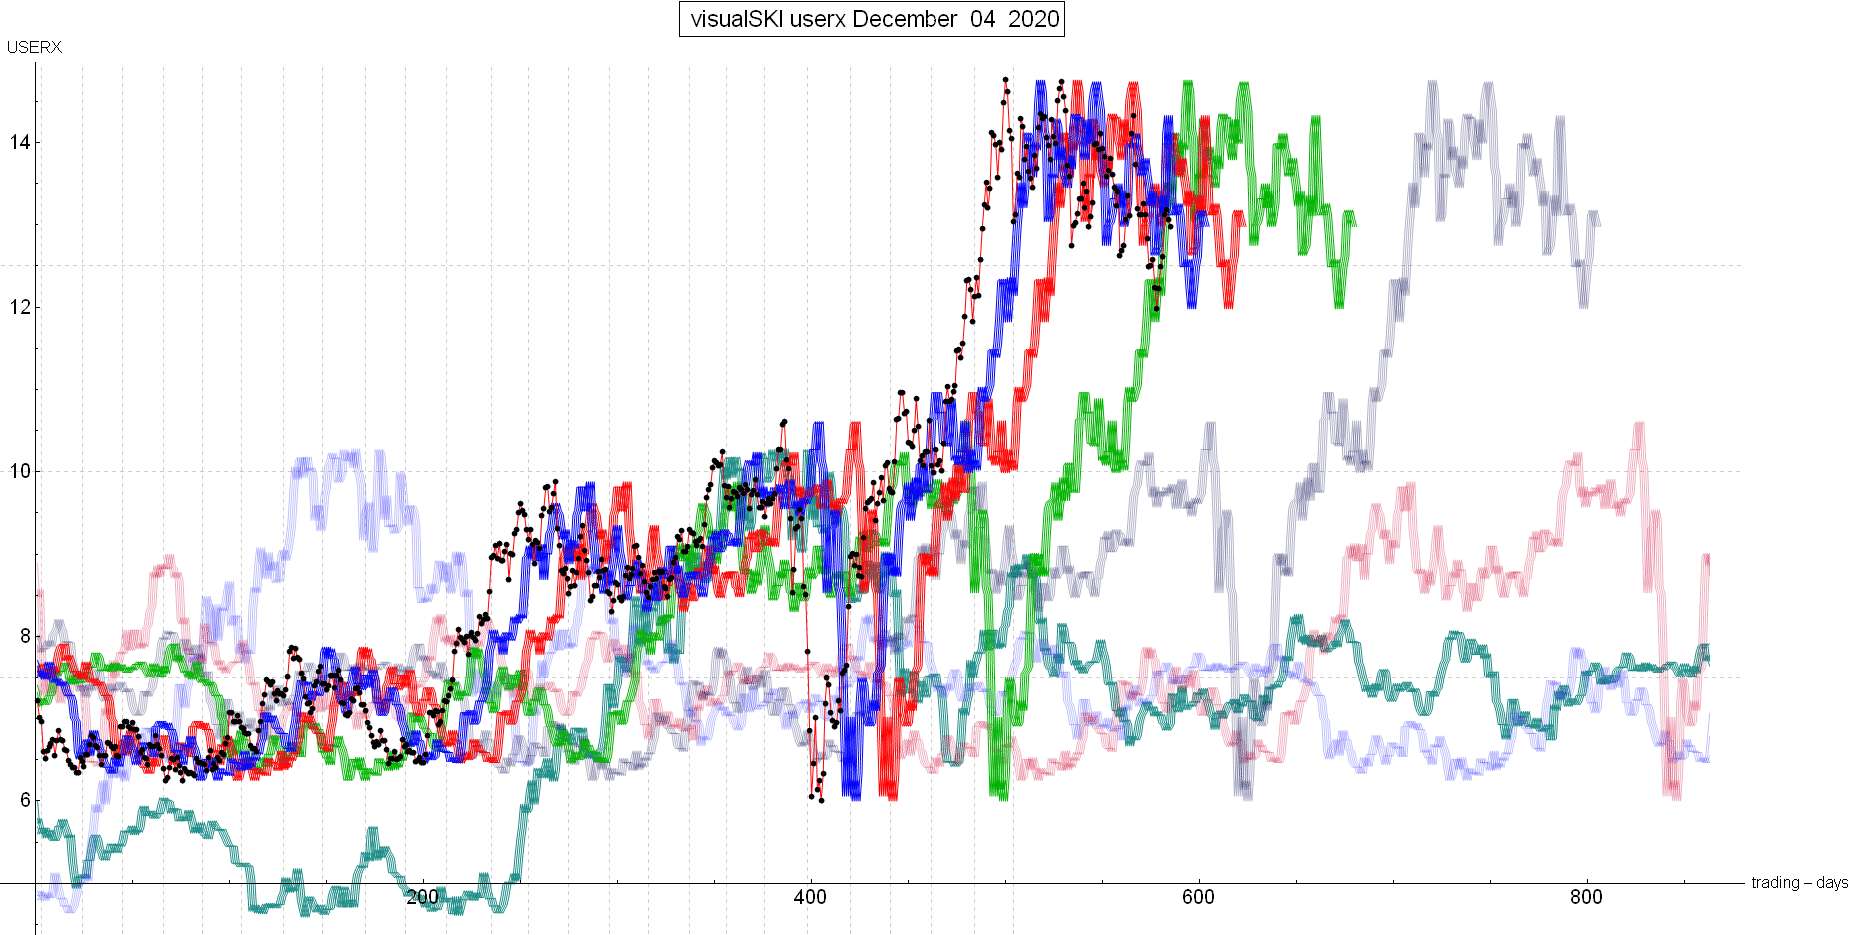
by the indices themselves. New Material The last SKI Report, written on 11/15/20, described how the gold stocks (USERX and the HUI) had declined into another (the 5th during 2020) potential bingo-low 16-20 index buy signal on 11/11/20 at USERX 13.12. But the really bullish 35-39 index buy signal had not yet generated. That buy signal was quite close to generating: With USERX at 13.26, it would likely take USERX two trading days at over 13.14 to generate the index buy that would be a maximum buy-point. Frankly, Jeff was expecting that buy signal. After that Sunday’s public report, USERX declined to 13.13 on Monday (11/16/20). The decline to below 13.14 made it less likely that the 35-39 index’s buy signal (as prices go above the prices from 35-39 trading days earlier) would generate. Each penny is meaningful for the SKI indices. The next day’s decline to below 13.12 went below the prior 16-20 index’s buy signal and was clearly avoiding the 35-39 index’s needed buy signal. That was distinctly bearish behavior as USERX dropped to 12.83. The next lower index was the master 92-96 index. It is referred to as a “master” index because it provides the most important signals. Jeff was primarily long from the Long-Term Mechanical SKI 221 index buy signal at USERX 7.08 on 3/27/20, but had bought more on the Regular Mechanical SKI 92—96 index buy signal on 4/27/20 at USERX 9.65, and yet more on the 6/15/20 16-20 index buy signal that had marked the exact first corrective bottom. The continuing bullish scenario needed USERX to stay above the 92-96 index. The market’s failure to generate the 35-39 index’s buy signal did yield the continuing decline to the 92-96 index. The decline to USERX 12.24 on 11/23/20 hit/touched the index and the further decline to 11.98 on 12/24/20 brought the index to within one trading day of generating its sell signal (as the current price goes below the prices from 92-96 trading days earlier). USERX needed to rise to above 12.14 the next day to avoid that sell signal. It did so on 11/25/20 via a close at 12.23. The next day, USERX needed to again close above 12.14 to avoid the 92-96 index’s sell signal. It did so on 11/27/20 via a rise to 12.49. The next day, USERX needed to rocket higher to above 12.96 to avoid the sell signal OR (alternatively) it needed to close above 12.58 and then above 12.96 to maintain the 92-96 index buy signal. The 11/28/20 rise to 12.62 (above 12.58) generated the index sell signal for the execution the next day, but then the “precise, rather amazing” (but not “surprising”) 4% rise the next day (11/29/20) to USERX 13.12 instantly negated the 92-96 index sell signal. USERX had risen back to the prior 16-20 index buy signal at 13.12. The next day (11/30/20) yielded a further rise to 13.18, but failed to go above the rising 92-96 index’s back prices at 13.21. The special 2 days Down and 5 days Up USERX run pattern yielded a decline on 12/03/20 to 13.07. That sold the master 92-96 index. The above day-to-day tedium (that is SKI-important and precise), is depicted in the chart of the SKI indices here. The black dots are the price of USERX. The green line is the master 92-96 index. The blue line is the 16-20 index and the red line is the 35-39 index. Can you see how USERX dropped to the green line, stayed just above it, and then rocketed higher for 5 trading days to barely stay above the RISING green line? It hit/touched the rising blue and red line on the rise. And then, on 12/03/20, the gold stocks dropped a little and USERX’s small decline to 13.07 went below all 3 index lines. Such behavior is historically dangerous/bearish. Any USERX decline on this coming Monday (12/07/20) would reinforce the bearish case. The bullish case SKI-needs a rather instant rocket higher to get back above the rising 92-96 index (the green chart line) and the blue and red index lines. Otherwise, the declining 16-20 index (the blue chart line) should “force” the gold stocks lower. Best Wishes, Jeff If you are interested in following and learning more about the SKI indices, I'll write another Report in three weeks or you can shell out the big bucks for a SKI subscription. Weekly Updates are available by subscribing for a month (or longer if you're wise and cheap enough to want to save money) at my website www.skigoldstocks.com for the princely sum of $30 (for a one month subscription) or more ($240 for an annual subscription). I also provide more frequent intra-week daily messages/alerts at a slightly higher price along with access to our informative Forum. ###  SKI archives SKI archives
email: jeff@skigoldstocks.com
Jeffrey M. Kern,Ph.D., is an academic psychologist with a specialty in the measurement and prediction of human behavior. The communications provided are for informational purposes only and are not intended to be investment advice or recommendations for specific investment decisions. Dr. Kern is not a registered investment advisor, but is registered as a commodity trading advisor (CTA). The information provided is considered accurate, but cannot be guaranteed. Investments/trading in narrow market segments or gold futures is for individuals willing to accept a higher level of risk for the opportunity of greater returns. Past performance is no guarantee of future performance. His website is www.skigoldstocks.com.
Communications should be sent to: jeff@skigoldstocks.com.
Copyright © 2002-2024 Jeffrey Kern. All Rights Reserved. 321gold Ltd

| 