 Special SKI Report #245 Special SKI Report #245
Gold Stock SKI-Bingos? Jeffrey M. Kern, Ph.D.
Email: jeff@skigoldstocks.com
USERX | historicals
Written Sunday Nov 15, 2020
Published Nov 16, 2020 Current USERX price = 13.26, Down 19 cents (1.4%) since the last report 3 weeks ago. Introduction (repeated from prior Reports):
I have been using my unique SKI indices
to predict price changes in the precious metals' market for more
than two decades. And my indices continue to mark the critical
points. I have initiated a subscription website since 1/13/06
(yes, Friday the 13th) after having posted free updates for years
at www.321gold.com. SKI is a timing service; although
almost everyone seems to believe that market timing is impossible,
that IS what the SKI indices have done for 36 years.
The SKI indices contain short-term (16-20
trading days), intermediate-term (35-39 trading days), and long-term
(92-96 trading days) indices. A more comprehensive description
of these mathematical indices and their history is found here.
Basically, the indices compare today's price to prices from a
specified prior time period. The name of the index specifies the
time period (e.g., 92-96 index = compare today's price to prices
from 96, 95, 94, 93, and 92 trading days earlier). Although I
use the oldest gold mutual fund, USERX, for analyses, the predictions
are applicable to the broad precious metals' market. I do not
recommend or analyze specific stocks, but my subscribers from
around the world regularly discuss individual issues on our Forum.
In addition to the truly unique SKI indices, I also use "run
patterns" to guesstimate turning points in the precious metals'
market. A "run" refers to a pattern of daily up and
down market closing prices. If the market has 3 consecutive days
of higher closing prices, the run is "3 up". If prices
then decline for 2 consecutive days, the run becomes "3 up
and 2 down". If prices then close higher the next day, the
run changes to "2 down and 1 up". Some people have referred
to run patterns as "worms". A run pattern is only completed
after the direction of closing prices has changed. I have compiled
a listing of every run pattern that has ever occurred and generated
probabilities that the end of the run marks a high or a low, moderated
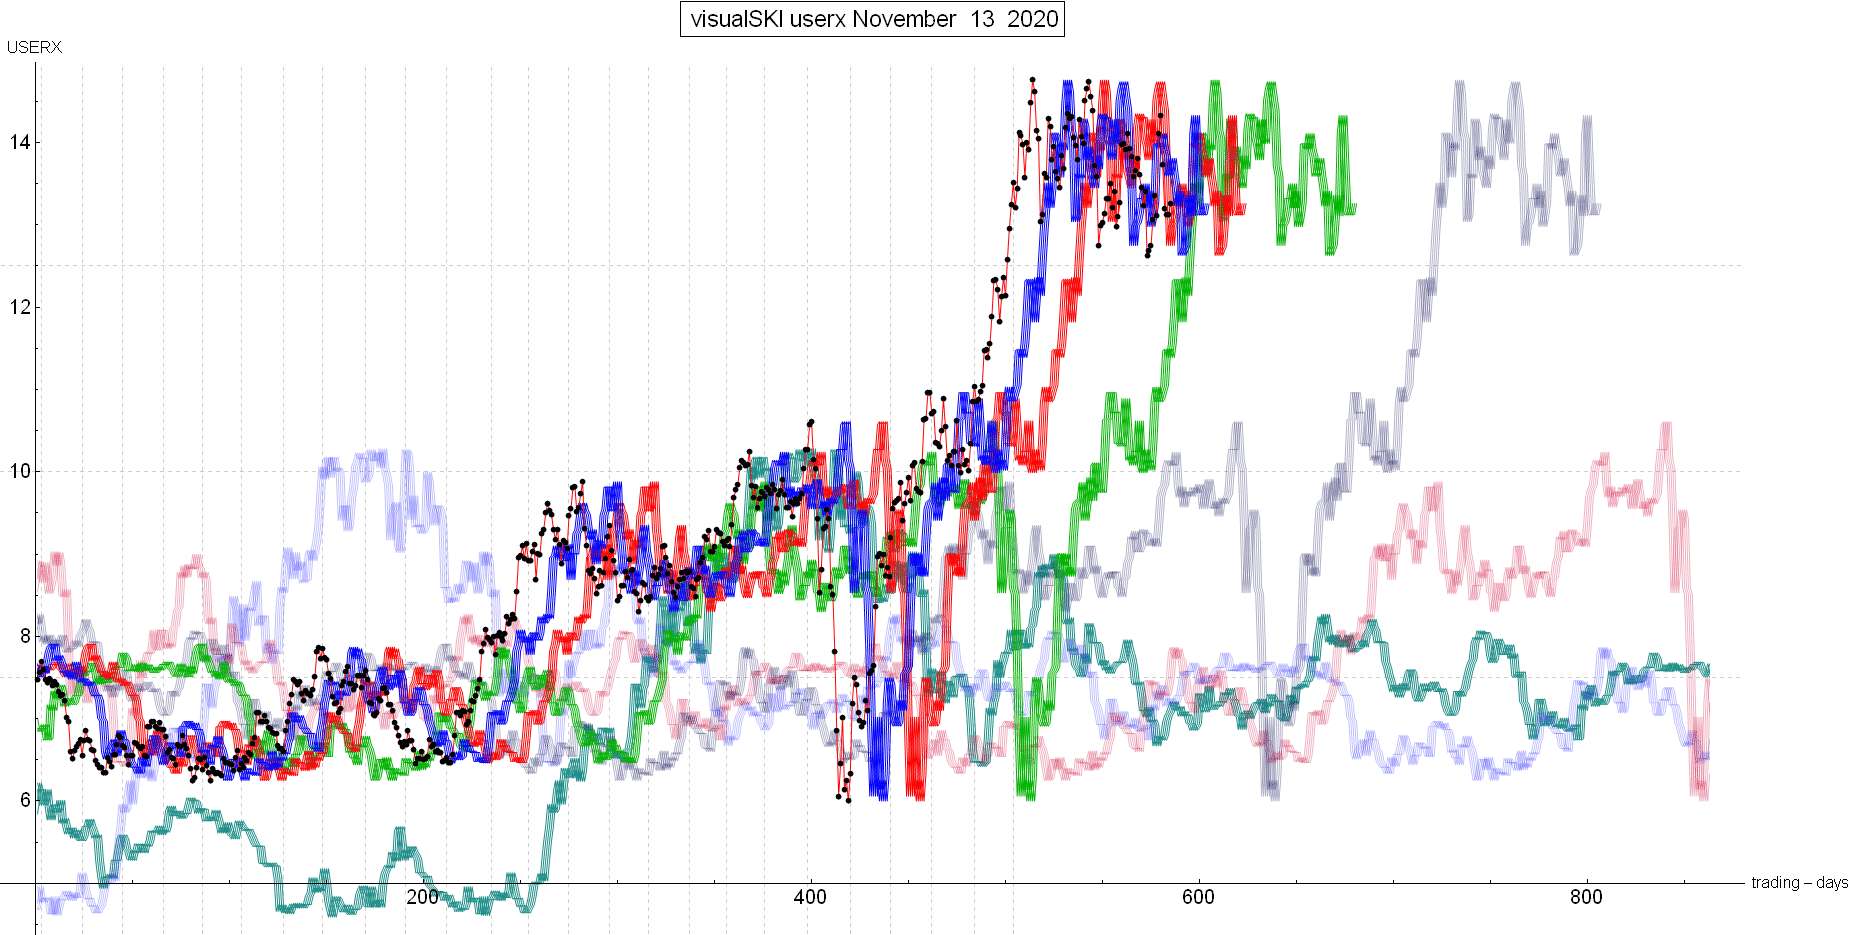
by the indices themselves. New Material This will require your time and some effort, but is rather simple. I’ll summarize the prior 10/25/20 SKI Report, and then provide the NEW summary section of this weekend’s subscriber Update. It will take you perhaps 15-30 minutes of time if you actually read it, sentence by sentence. Subscribers may complain, but I hope that this will help you as I’ve been publicly doing for 2 decades. The last SKI Report, written on 10/25/20, concluded that “Now, due to the 35-39 index’s sell signal on 10/22/20 at USERX 13.61, a continuing short-term decline is likely, probably to below the 9/25/20 low of USERX 12.75. Friday’s decline to 13.45 began to move the 16-20 index towards its new buy signal. That contrarian index buys on declines and sells on rises. The simple index math shows that it would take at least a few trading days to generate the 16-20 index’s buy signal. The harder the decline, the greater the probability that the next 16-20 index buy signal would mark a low (“catch the falling knife”). It would likely be THE intermediate-term low from the 8/05/20-8/06/20 high in the gold stocks and gold. A new 35-39 index buy signal on a rise would be a subsequent disciplined buy-point despite the quick failure of the 35-39 index’s recent buy signal. SKI remains long-term bullish via the 218-222 index buy signal on 3/27/20 at 7.08 and the 92-96 index’s buy signal on 4/27/20 at 9.65.” What happened? Yes, the gold stocks did the quick plunge to below the 9/25/20 low of USERX 12.75. It took 3 trading days from that last public Report for USERX to drop from 13.45 to 12.63. And the USERX (and HUI) 16-20 index BOUGHT the plunge at 12.69 on 10/29/20 for a POTENTIAL exact intermediate-term low. Jeff bought back for what was another “bingo-buy”. The ensuing rise went into a 16-20 index sell that generated on 11/06/20 at USERX 14.33 into execution on 11/07/20 at USERX 13.73 (one day late). The subsequent quick plunge into last Wednesday (11/11/20) was accompanied by yet another potential bingo-buy at a higher low of USERX 12.12. That is described and updated below. Again, this is a reprint of the SUMMARY section of this weekend’s subscriber Update. “SKI Update 11/14/20 10:45 AM PST An Intra-Week Update IS expected: xxxx. Here’s the link to the visual presentation of the indices for the USERX SKI indices that includes all of the indices in one chart as of 11/13/20: http://www.imageshack.com/img923/6407/7yiZoZ.gif (Use Control+ to enlarge; if the link does not work, then copy and paste it in your browser) Legend: blue: 16-20 index, red: 35-39 index, green: 92-96 index
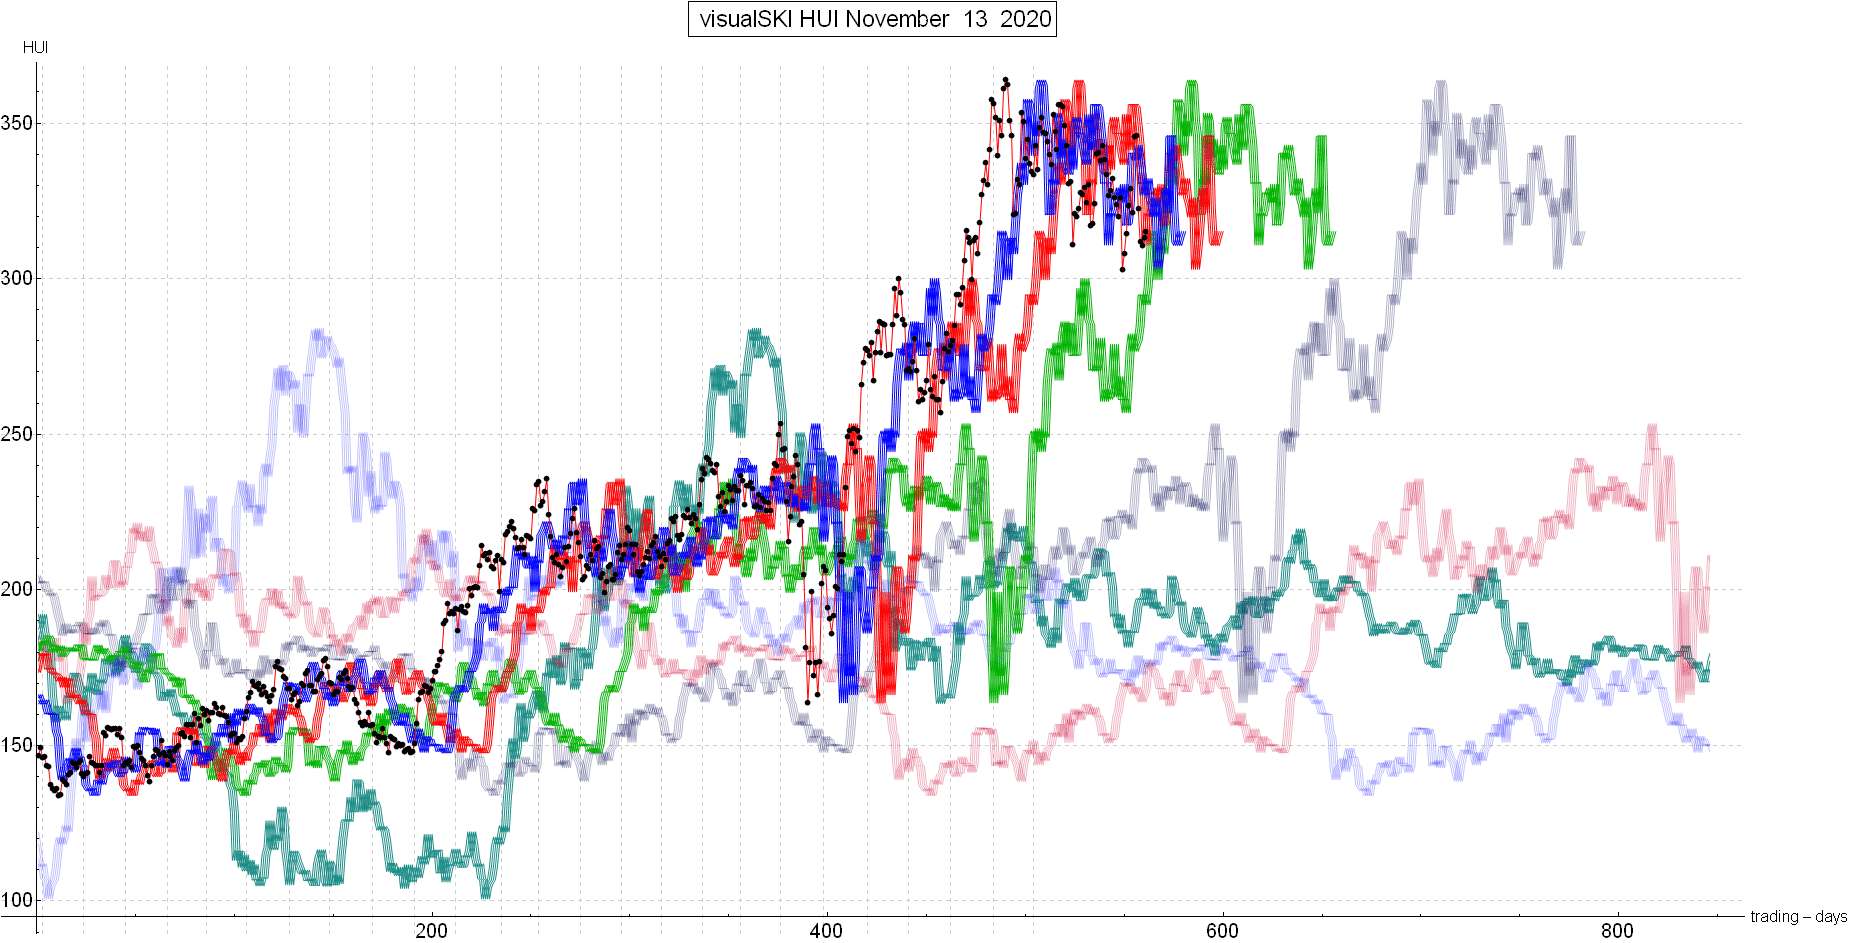
faded purple: 221 index, faded red: 442 index, faded blue: 663 index, turquoise: 884 index From last weekend (11/07/20): After the plunge to below the blue line occurred into the 10/28/20-10/29/20 16-20 index buy signal at USERX 12.69, a SKI-bingo rise did occur. USERX went back over the blue line on Friday (11/06/20) to generate the first resistance 16-20 index sell signal. Note how the red line 35-39 index peaked on 11/06/20 and USERX has not yet gotten above it for an intermediate-term buy signal. A further rise would do that, but the likelihood is for a short-term decline. The blue line is now SUPPORT on a decline (smile). Jeff doubts that a decline would go back again to below the blue line, but there is the possibility of a simultaneous decline to below the blue line while staying above the PLUNGING red line in 5-6 trading days. Jeff says “Buy” (the last one) if/WHEN USERX gets over the plunging red line. The surging green line is the current sell-stop. NOW: Note how every statement from last weekend was exactly correct, I would not change any of its words, and they remain in effect. I tell you (and emphasize) when Jeff/SKI is just wrong. So now, the 11/06/20 rise over the blue line marked at least a very short-term high and the ensuing quick plunge went back below the blue line for a potential 5th consecutive “bingo-buy-low” 16-20 index buy signal that executed on this past Wednesday (11/11/20) at USERX 13.12. The ensuing meager rise is threatening to go over the red line BEFORE going over the blue line. It will take 1-2 trading days to get over that LOW red line for a 35-39 index buy signal. BUY if that occurs. The rise over the red line would bullishly occur just BEFORE going over the blue line for some potential resistance (a 16-20 index sell signal again). Right or wrong, the sell-stop will then shift to any decline back below the red line. And that ultimate sell-stop green line continues to FLY higher. If/When the 35-39 index buy signal occurs, USERX should quickly rise over the blue line again and then remain above the rising red and green lines. PERIOD. This is the visual presentation of the indices for HUI SKI that includes all of the indices in one chart as of 11/13/20. In a sense, this HUI chart would be like the USERX chart after adjusting for USERX dividends: http://www.imageshack.com/img922/1702/MJV6g2.gif Use Control+ to enlarge; if the link does not work, then copy and paste it in your browser) HUI = 315.20, Down 8.9% during the past week. Repeated from last weekend (11/07/20): After the plunge to below the blue line occurred into the 10/28/20-10/29/20 16-20 index buy signal, a SKI-bingo rise did occur. The HUI’s rise went above the blue line on Thursday (11/05/20) and executed on Friday (11/06/20) for a first resistance 16-20 index sell signal. The HUI is in rather perfect synchrony with USERX, ala the plunging red line and surging green line. NEW/NOW: It turned out that the HUI’s 16-20 index sell signal on 11/06/20 at 346.08 marked an exact short-term high and beat USERX by 1 trading day. The HUI then plunged back below the blue line in exact synchrony with USERX to execute its new 16-20 index buy signal on 11/11/20 at 310.69 for a possible “bingo exact low”. The HUI is worrisomely now lagging USERX in going over its red line for a new 35-39 index buy signal. The HUI has hit/touched its red line for several days by staying above the 9/23/20 low of 310.18 rather beautifully, but it would take 2 consecutive days above 322.41 to generate its new 35-39 index buy signal in synchrony with USERX. This suggests that the HUI will rise 2+% on Monday and maintain that into Tuesday (11/16/20) to generate its new 35-39 index buy signal (above the red line). Other than that, the HUI remains in synchrony with USERX. Again, Jeff always follows USERX and uses the HUI as ancillary information, but the HUI has been good/useful (smile). Summary: USERX = 13.26, Down $1.07 (7.5%) for the week. COMEX Cash Gold dropped $64.40 (3.3%) to settle at $1885.70. Therefore, the gold stocks performed in line or slightly bearishly relative to gold. This relative indicator CONTINUES to be whipsawed almost each week and has been a contrary indicator during this entire “ping-pong” down/up/down/up/down 3-month correction. Current Position: No change, but about to buy to maximum long IF the 35-39 index generates its buy signal during this coming week. Jeff quickly bought back 50% (of what was previously sold) on the 10/29/20 16-20 index buy signal at USERX 12.69 to be about 53% long after having sold 80% at 13.61 the prior week for a quick 2.9% loss.Regular SKI bought on 4/27/20 for a potential bull market at USERX 9.65 and remains long. Jeff was primarily long from around 7.30 as the 221 index bought for Long-Term Mechanical SKI at 7.08 on 3/27/20 and that index remains long. Bottom Line: The pure long-term technical bull market remains intact until there is a USERX 92-96 index sell signal on a large decline and that sell-stop is flying higher. That sell-stop bottomed on 10/28/20-10/29/20 (for a potential 92-96 cycle low) simultaneously with a 16-20 index buy signal at USERX 12.69 for a bingo-low into last weekend’s 16-20 index sell signal. Now, multiple SKI indices have changed for a potentially better/safer buy with a new rising (higher) sell-stop. Last weekend’s 16-20 index sell signal yielded an extremely quick and large plunge to the 5th consecutive potential bingo-buy-low on last Wednesday’s (11/11/20) execution of a 16-20 index BUY signal at USERX 13.12. And USERX held to the proverbial 1-penny plus rose meagerly but SKI-perfectly on Thursday-Friday. A new 35-39 index buy signal in just 1-3 trading days REQUIRES a Jeff-discipline maximum buy if when USERX holds above about 13.14 for 2 trading days (exact numbers in this Update). The sell-stop would change to a quick and rising 35-39 index sell signal. Right or wrong, you read JeffSKI for these types of moments, so Jeff says “Execute” to personal risk-tolerance for the potential about 40+% multi-month rise into a major top IF the 35-39 index buy signal generates and an Intra-Week Buy Update is sent.” Discipline is as important as index signals. Best Wishes, Jeff If you are interested in following and learning more about the SKI indices, I'll write another Report in three weeks or you can shell out the big bucks for a SKI subscription. Weekly Updates are available by subscribing for a month (or longer if you're wise and cheap enough to want to save money) at my website www.skigoldstocks.com for the princely sum of $30 (for a one month subscription) or more ($240 for an annual subscription). I also provide more frequent intra-week daily messages/alerts at a slightly higher price along with access to our informative Forum. ###  SKI archives SKI archives
email: jeff@skigoldstocks.com
Jeffrey M. Kern,Ph.D., is an academic psychologist with a specialty in the measurement and prediction of human behavior. The communications provided are for informational purposes only and are not intended to be investment advice or recommendations for specific investment decisions. Dr. Kern is not a registered investment advisor, but is registered as a commodity trading advisor (CTA). The information provided is considered accurate, but cannot be guaranteed. Investments/trading in narrow market segments or gold futures is for individuals willing to accept a higher level of risk for the opportunity of greater returns. Past performance is no guarantee of future performance. His website is www.skigoldstocks.com.
Communications should be sent to: jeff@skigoldstocks.com.
Copyright © 2002-2024 Jeffrey Kern. All Rights Reserved. 321gold Ltd

| 