 Special SKI Report #162 Special SKI Report #162
Gold Stock Update: Unusual 92-96 Index Buy Signal Jeffrey M. Kern, Ph.D.
Email: jeff@skigoldstocks.com
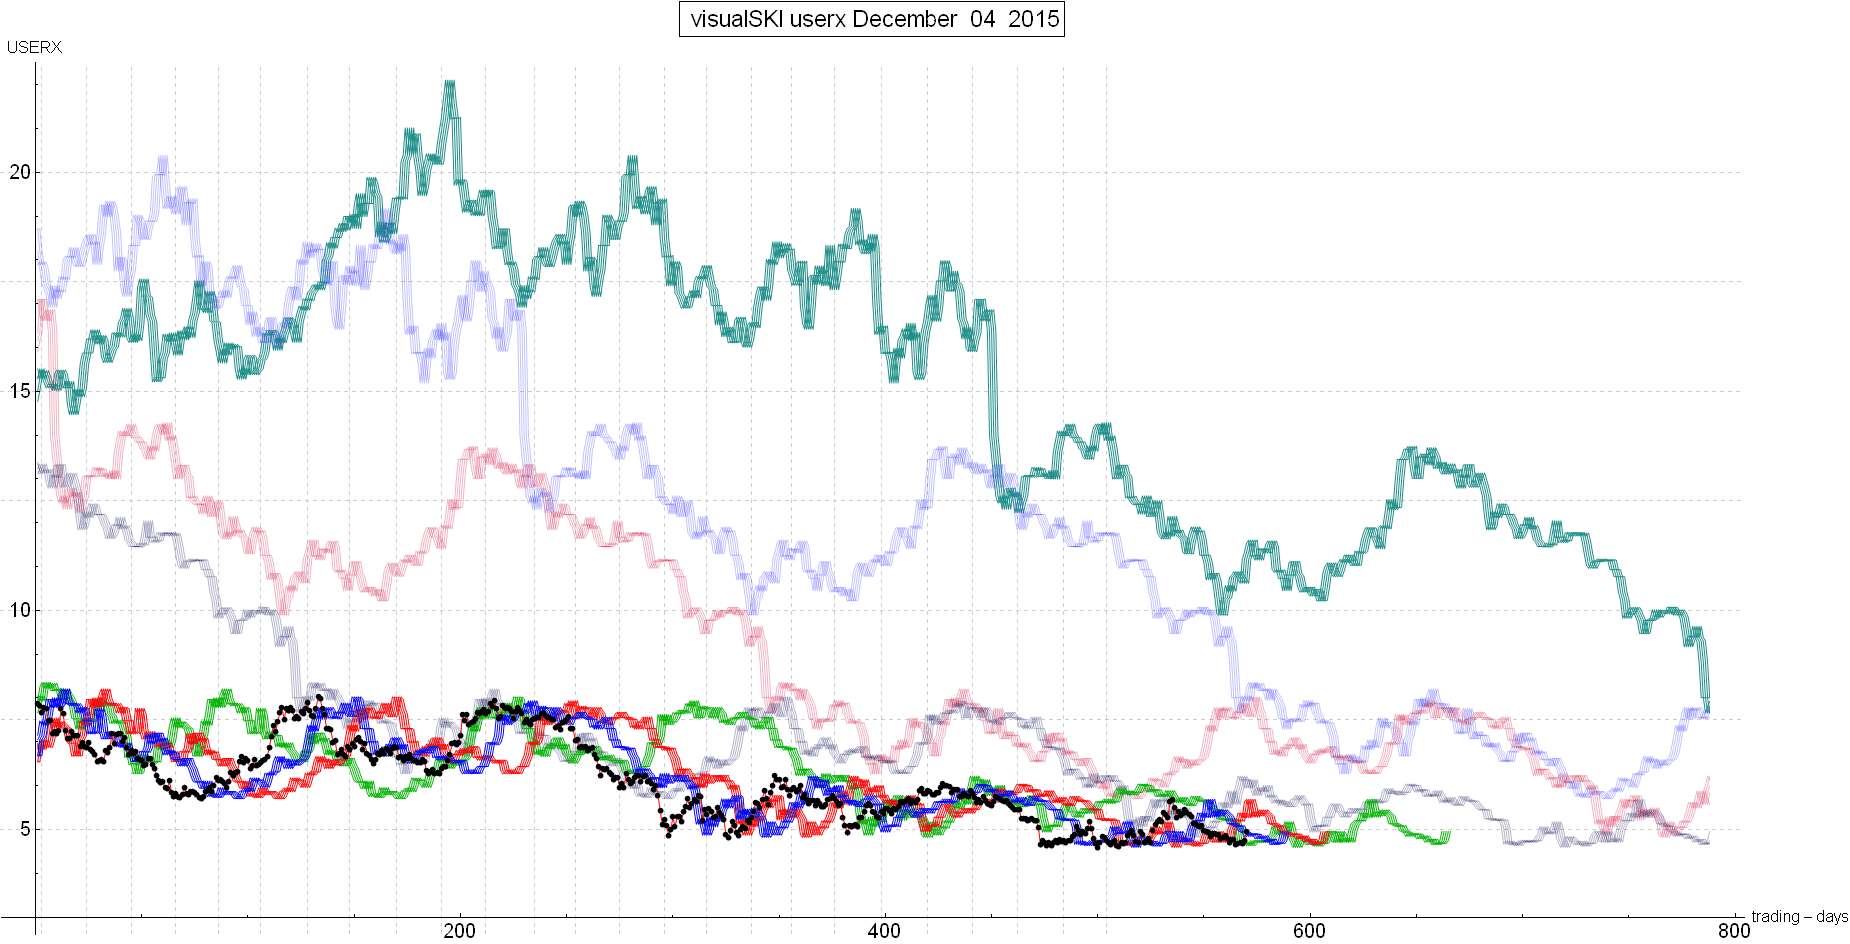
USERX | historicals
Written Sunday Dec 6, 2015
Published Dec 7, 2015 Current USERX price = 4.96, Up 1 cent (.2%) since the last report 4 weeks ago. Introduction (repeated from prior Reports):
I have been using my unique SKI indices
to predict price changes in the precious metals' market for more
than two decades. And my indices continue to mark the critical
points. I have initiated a subscription website since 1/13/06
(yes, Friday the 13th) after having posted free updates for years
at www.321gold.com. SKI is a timing service; although
almost everyone seems to believe that market timing is impossible,
that IS what the SKI indices have done for 36 years.
The SKI indices contain short-term (16-20
trading days), intermediate-term (35-39 trading days), and long-term
(92-96 trading days) indices. A more comprehensive description
of these mathematical indices and their history is found here.
Basically, the indices compare today's price to prices from a
specified prior time period. The name of the index specifies the
time period (e.g., 92-96 index = compare today's price to prices
from 96, 95, 94, 93, and 92 trading days earlier). Although I
use the oldest gold mutual fund, USERX, for analyses, the predictions
are applicable to the broad precious metals' market. I do not
recommend or analyze specific stocks, but my subscribers from
around the world regularly discuss individual issues on our Forum.
In addition to the truly unique SKI indices, I also use "run
patterns" to guesstimate turning points in the precious metals'
market. A "run" refers to a pattern of daily up and
down market closing prices. If the market has 3 consecutive days
of higher closing prices, the run is "3 up". If prices
then decline for 2 consecutive days, the run becomes "3 up
and 2 down". If prices then close higher the next day, the
run changes to "2 down and 1 up". Some people have referred
to run patterns as "worms". A run pattern is only completed
after the direction of closing prices has changed. I have compiled
a listing of every run pattern that has ever occurred and generated
probabilities that the end of the run marks a high or a low, moderated
by the indices themselves. New Material The last gold stock SKI Report, written on Sunday 11/08/15, described how the gold stocks (USERX) had behaved in a bearish manner since hitting/touching the resistance 92-96 index on 10/15/15 and then again during the day on 10/28/15. But that Report also raised the possibility that a low had been reached on 11/06/15 because USERX was still above the 35-39 index and the long-term 221 index while having generated a 16-20 index buy signal. That 11/06/15 date did not turn out to be THE low for the gold stocks (e.g., HUI and GDX), but they didn’t go much lower. USERX (the key dependent measure) DID continue to decline and it went below all of the SKI indices in a continuing bearish manner. Therefore, a new SKI buy signal did not generate. SKI did become open to a new buy signal, if it were to occur. A very interesting period began on the day after the U.S. Thanksgiving Day holiday (11/27/15). On that day, the master 92-96 index’s back prices were about to drop from a low price of USERX 5.05 to a low back price of USERX 4.66. That’s because USERX had plunged from 5.05 to 4.66 on 7/20/15. That was 96 trading days before the day after Thanksgiving. On 11/27/15, USERX dropped a solid 12 cents from 4.78 to close at EXACTLY 4.66. Therefore, the 92-96 index was hit/touched once again. The index has been functioning as resistance for years now so it was likely that the hit/touch of the index would simply yield a continuing decline. But it also could have been the beginning of a move to actually generate the index’s buy signal. After 11/27/15, USERX went up and down a little, continuing to hit/touch the 92-96 index without generating that buy signal. On this past Thursday (12/03/15), USERX needed to close over 4.74 to generate the actual index signal. USERX closed at 4.75 and the 92-96 index’s buy signal WAS generated. Prices usually rise the day after the index signal is generated, so Friday’s (12/04/15) strong rise was not surprising. Any time the 92-96 index buys on the SKI Path of Trades there is the possibility of a true bull market. This buy signal was quite unusual and the following will appear to be complicated. The buy signal is XXed Out. That means that it can even mark a high as of this past Friday (12/04/15). But this buy signal occurred during oversold conditions (defined as when a buy signal occurs after an oversold 16-20 index buy signal). Therefore, it can be signaling a further rise, but it should NOT be a true bull market that yields 100%-500% gains during the next year. Conclusion There is the potential for a continuing rise in the gold stocks due to this past Thursday’s generation of a master 92-96 index buy signal. But this should not be the start of a true SKI bull market. What matters is the sell stop: A new 92-96 index sell signal. That would occur when USERX declines to below the green line on this complimentary SKI chart. You should be able to see that the green line remains rather flat for a lengthy period of time. In other words, if one is long the gold stocks from this past Thursday-Friday’s buy signal, this rise will need to continue for months in order for the sell-stop to be activated at a profit. That CAN occur here. As other technicians have reported, this past week’s Commitment of Traders Report was unusually bullish. Just do not remain long if the 92-96 index’s sell-stop is activated. Best Wishes, Jeff If you are interested in following and learning more about the SKI indices, I'll write another Report in three weeks or you can shell out the big bucks for a SKI subscription. Weekly Updates are available by subscribing for a month (or longer if you're wise and cheap enough to want to save money) at my website www.skigoldstocks.com for the princely sum of $25 (for a one month subscription) or more ($200 for an annual subscription). I also provide more frequent intra-week messages/alerts at a slightly higher price along with access to our informative Forum and a managed gold futures program. The precious metals are in a very long-term (decade+) up-trend but are the most precarious, volatile, and psychologically difficult market in the world (in my opinion). That's the way it's always been. ###  SKI archives SKI archives
email: jeff@skigoldstocks.com
Jeffrey M. Kern,Ph.D., is an academic psychologist with a specialty in the measurement and prediction of human behavior. The communications provided are for informational purposes only and are not intended to be investment advice or recommendations for specific investment decisions. Dr. Kern is not a registered investment advisor, but is registered as a commodity trading advisor (CTA). The information provided is considered accurate, but cannot be guaranteed. Investments/trading in narrow market segments or gold futures is for individuals willing to accept a higher level of risk for the opportunity of greater returns. Past performance is no guarantee of future performance. His website is www.skigoldstocks.com.
Communications should be sent to: jeff@skigoldstocks.com.
Copyright © 2002-2024 Jeffrey Kern. All Rights Reserved. 321gold Ltd

| 