 Special SKI Report #161 Special SKI Report #161
Gold Stock Update: Low? Jeffrey M. Kern, Ph.D.
Email: jeff@skigoldstocks.com
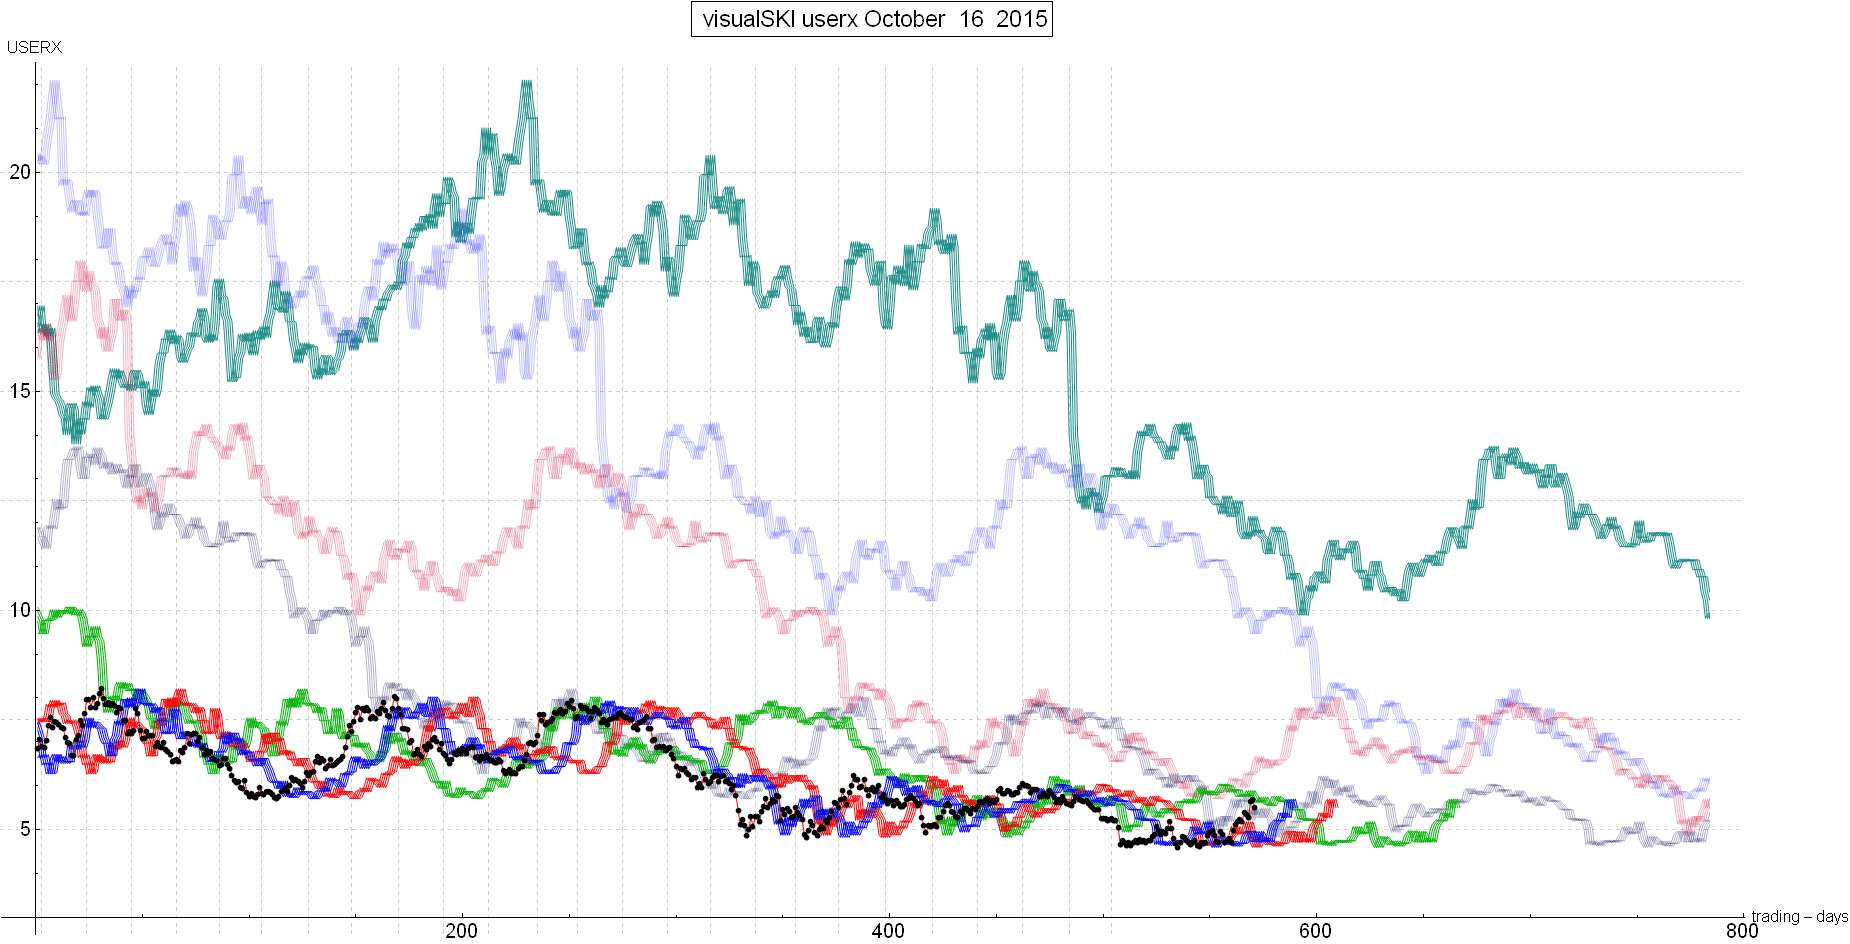
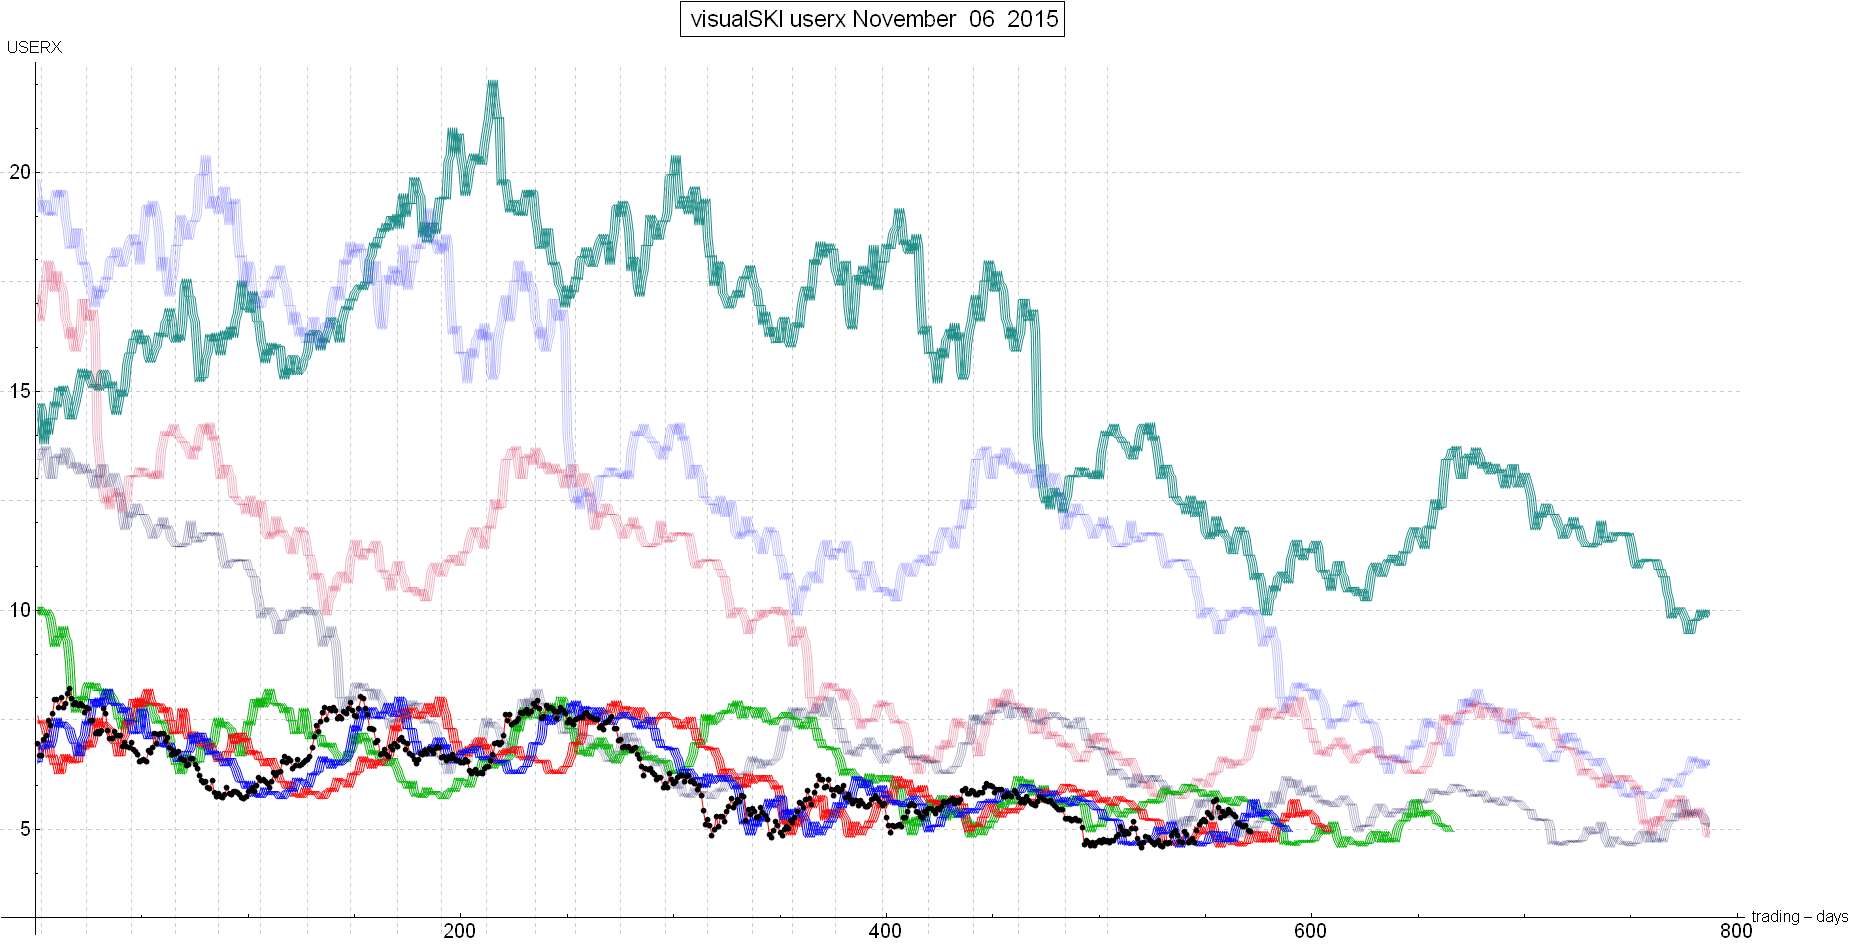
USERX | historicals
Written Sunday Nov 8, 2015
Published Nov 9, 2015 Current USERX price = 4.95, Back Down 55 cents(10%) since the last report 3 weeks ago. Introduction (repeated from prior Reports):
I have been using my unique SKI indices
to predict price changes in the precious metals' market for more
than two decades. And my indices continue to mark the critical
points. I have initiated a subscription website since 1/13/06
(yes, Friday the 13th) after having posted free updates for years
at www.321gold.com. SKI is a timing service; although
almost everyone seems to believe that market timing is impossible,
that IS what the SKI indices have done for 36 years.
The SKI indices contain short-term (16-20
trading days), intermediate-term (35-39 trading days), and long-term
(92-96 trading days) indices. A more comprehensive description
of these mathematical indices and their history is found here.
Basically, the indices compare today's price to prices from a
specified prior time period. The name of the index specifies the
time period (e.g., 92-96 index = compare today's price to prices
from 96, 95, 94, 93, and 92 trading days earlier). Although I
use the oldest gold mutual fund, USERX, for analyses, the predictions
are applicable to the broad precious metals' market. I do not
recommend or analyze specific stocks, but my subscribers from
around the world regularly discuss individual issues on our Forum.
In addition to the truly unique SKI indices, I also use "run
patterns" to guesstimate turning points in the precious metals'
market. A "run" refers to a pattern of daily up and
down market closing prices. If the market has 3 consecutive days
of higher closing prices, the run is "3 up". If prices
then decline for 2 consecutive days, the run becomes "3 up
and 2 down". If prices then close higher the next day, the
run changes to "2 down and 1 up". Some people have referred
to run patterns as "worms". A run pattern is only completed
after the direction of closing prices has changed. I have compiled
a listing of every run pattern that has ever occurred and generated
probabilities that the end of the run marks a high or a low, moderated
by the indices themselves. New Material The last gold stock SKI Report, written on Sunday 10/18/15, described how the gold stocks (USERX) had risen into long-term SKI indices’ resistance, that a specific time and price target should be reached prior to this next SKI Report, and that a bull market had not (yet?) started. The complimentary chart in that last Report showed how the gold stocks had risen over the faded purple line for a long-term 221 index buy signal but had not risen over the green line for a 92-96 index long-term buy signal that would be the next required step in setting up a bull market. The specific time and price target couldn’t be included in that last SKI Report because it was reserved for subscribers. The prior rise over the red line had occurred 11 times since 1974 and had yielded one rise for 15 trading days, 9 rises that topped 17-21 trading days after the buy signal at a 17-21% gain, and one rise that lasted for 28 trading days. Therefore, the specific historical prediction was for the “normal” 17-21 trading day rise (that is one-half cycle of the 35-39 index buy signal). When the last SKI Report was written, it was only 8 trading days from the 35-39 index buy signal. The gold stocks then declined a little and as of 10/27/15, USERX was only up to 5.35 on Day 15. Therefore, Jeff had to expect a rather strong immediate rise into the green line 92-96 index heading into the 10/28/15 U.S. Federal Reserve announcement. Time was running out…. The gold stocks surged the expected 4% on 10/28/15 and were hitting/touching the 92-96 index’s resistance again. The bullish case needed a rise over that green line: Although that would be a top, it was the next step needed to continue the set-up for a bull market (and then a decline to below the green line followed by a quick rise over the 92-96 index for a bull market, all while USERX remained above the 221 index’s faded purple line). But the gold stocks reversed sharply to the downside after that 10/28/15 Federal Reserve announcement. It was Day 16 and time had basically run out. Therefore, Jeff had to turn bearish on 10/29/15: After all, the 92-96 index had been reached again on 10/28/15, the rise had been rejected by the index’s resistance, and time was up. Gold has plunged about $89 from that time and the gold stocks have also experienced a solid decline. But USERX has continued to out-perform other gold stock measures (e.g., HUI, GDX) due to its international holdings (and its general position as a broader “superior” measure of the broad universe of world-wide gold/silver mining companies). This past Friday (11/06/15), despite 4+% declines in HUI/GDX, USERX only declined 3 cents (.6%). Conclusion Here’s the current chart of the SKI indices. Although I have to reserve the specific USERX numbers for subscribers, you should be able to see how USERX has declined to below its blue line for a supportive (short-term oversold) 16-20 index buy signal. You should also be able to see how USERX is just barely above/at its important long-term faded purple line that has maintained the 221 index’s buy signal. And lastly, you should be able to see how the decline on Friday has just now hit/touched the 35-39 index’s red line. A decline below that red line should be immediately bearish, but the 16-20 index’s oversold buy signal (the index buys on declines and sells on rises) coupled with the 221 index and the hit/touch of the red line’s 35-39 index, all point to a low being formed right here and now. However, this decline has made it quite difficult to obtain a bull market and makes it likely that the next rise will fail again as it reaches the resistance indices. The only way to get a bull market (as always) is for the gold stocks to rise over that green line, fall back very quickly below it, and then rise over it. There’s not much time left for that to happen (a matter of a few weeks here) and it does not appear to be likely, but we’ll soon see…. Best Wishes, Jeff If you are interested in following and learning more about the SKI indices, I'll write another Report in three weeks or you can shell out the big bucks for a SKI subscription. Weekly Updates are available by subscribing for a month (or longer if you're wise and cheap enough to want to save money) at my website www.skigoldstocks.com for the princely sum of $25 (for a one month subscription) or more ($200 for an annual subscription). I also provide more frequent intra-week messages/alerts at a slightly higher price along with access to our informative Forum and a managed gold futures program. The precious metals are in a very long-term (decade+) up-trend but are the most precarious, volatile, and psychologically difficult market in the world (in my opinion). That's the way it's always been. ###  SKI archives SKI archives
email: jeff@skigoldstocks.com
Jeffrey M. Kern,Ph.D., is an academic psychologist with a specialty in the measurement and prediction of human behavior. The communications provided are for informational purposes only and are not intended to be investment advice or recommendations for specific investment decisions. Dr. Kern is not a registered investment advisor, but is registered as a commodity trading advisor (CTA). The information provided is considered accurate, but cannot be guaranteed. Investments/trading in narrow market segments or gold futures is for individuals willing to accept a higher level of risk for the opportunity of greater returns. Past performance is no guarantee of future performance. His website is www.skigoldstocks.com.
Communications should be sent to: jeff@skigoldstocks.com.
Copyright © 2002-2024 Jeffrey Kern. All Rights Reserved. 321gold Ltd

| 