 Special SKI Report #262 Special SKI Report #262
Gold Stock Update Jeffrey M. Kern, Ph.D.
Email: jeff@skigoldstocks.com
USERX | historicals
Written Sunday Nov 21, 2021
Published Nov 22, 2021 Current USERX price = 12.86, Up another 66 cents (5.4%) since the last report 3 weeks ago. Introduction (repeated from prior Reports):
I have been using my unique SKI indices
to predict price changes in the precious metals' market for more
than two decades. And my indices continue to mark the critical
points. I have initiated a subscription website since 1/13/06
(yes, Friday the 13th) after having posted free updates for years
at www.321gold.com. SKI is a timing service; although
almost everyone seems to believe that market timing is impossible,
that IS what the SKI indices have done for 36 years.
The SKI indices contain short-term (16-20
trading days), intermediate-term (35-39 trading days), and long-term
(92-96 trading days) indices. A more comprehensive description
of these mathematical indices and their history is found here.
Basically, the indices compare today's price to prices from a
specified prior time period. The name of the index specifies the
time period (e.g., 92-96 index = compare today's price to prices
from 96, 95, 94, 93, and 92 trading days earlier). Although I
use the oldest gold mutual fund, USERX, for analyses, the predictions
are applicable to the broad precious metals' market. I do not
recommend or analyze specific stocks, but my subscribers from
around the world regularly discuss individual issues on our Forum.
In addition to the truly unique SKI indices, I also use "run
patterns" to guesstimate turning points in the precious metals'
market. A "run" refers to a pattern of daily up and
down market closing prices. If the market has 3 consecutive days
of higher closing prices, the run is "3 up". If prices
then decline for 2 consecutive days, the run becomes "3 up
and 2 down". If prices then close higher the next day, the
run changes to "2 down and 1 up". Some people have referred
to run patterns as "worms". A run pattern is only completed
after the direction of closing prices has changed. I have compiled
a listing of every run pattern that has ever occurred and generated
probabilities that the end of the run marks a high or a low, moderated
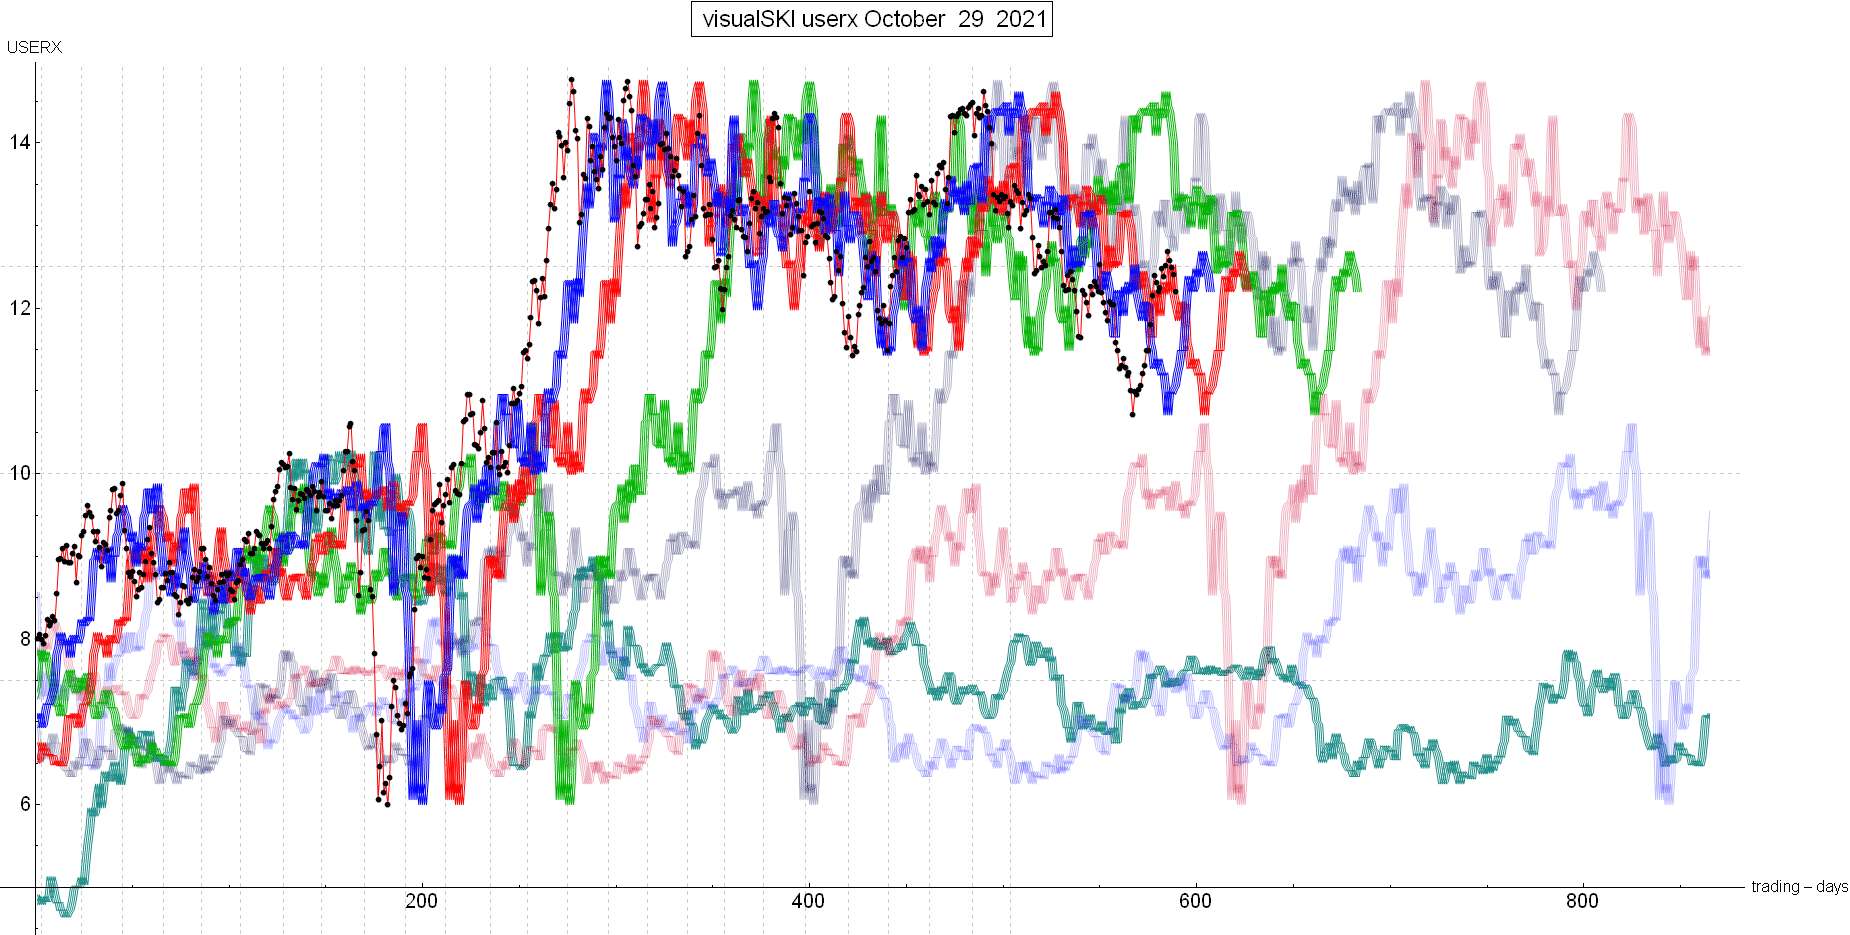
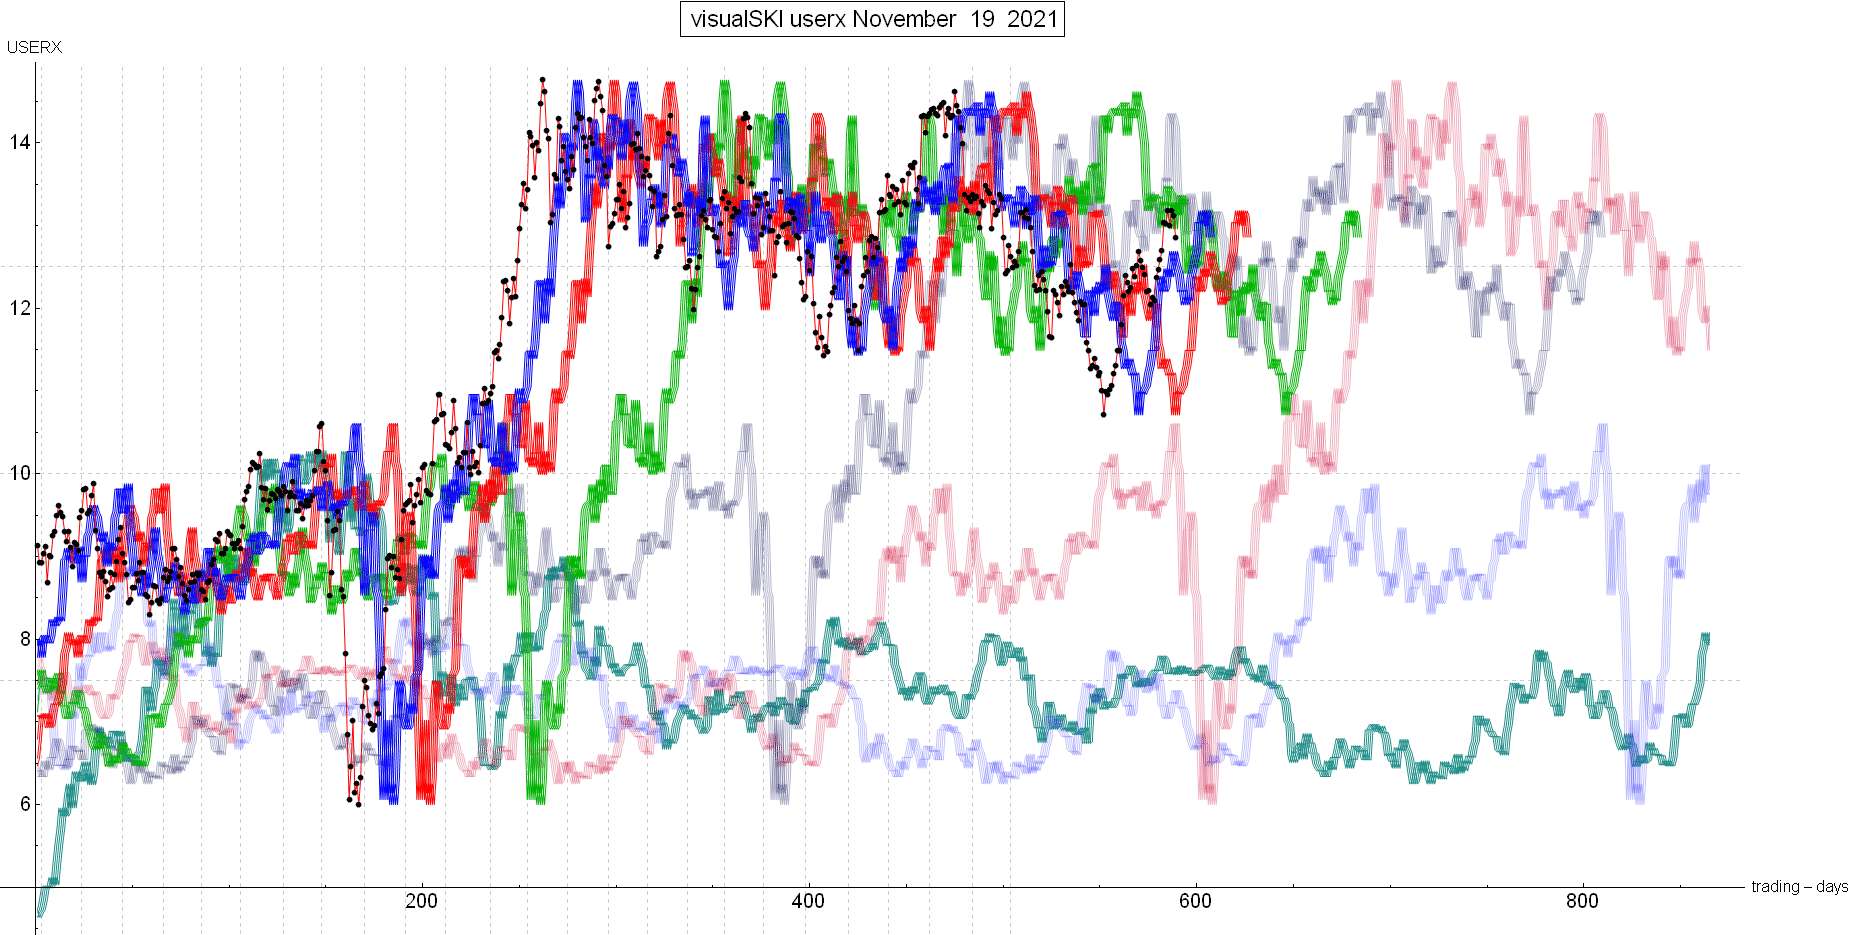
by the indices themselves. New Material The last SKI Report, written on 10/31/21, was short-term bearish after the gold stocks had risen strongly from the late September low at USERX 10.71. The rise had taken USERX to above the 16-20 index AND (almost simultaneously) above the 35-39 index. Those indices represented 1st and 2nd resistances. The prior week’s high at USERX 12.69 had also exactly hit/touched the faded purple 218-222 index line. More importantly, the new index signals “activated SKI” for potential index buy signals on a decline during the next 1-2 weeks. This was the SKI index chart as of 10/30/21, with the black dots representing the USERX price. The short-term decline occurred during that next week, into and after the U.S. Federal Reserve announcement on 11/03/21. USERX declined to its blue 16-20 index support line and its red 35-39 index line. When you look at the current SKI index chart (below), it may look like USERX (the black dots) went just below the blue line to generate the expected 16-20 index’s buy signal, but the mathematical formula didn’t quite generate the buy signal. Therefore, we missed buying on that low. The subsequent sharp rise from 11/04/21 at USERX 12.09 went right up to hit/touch the green line 92-96 index and hit/touched the faded purple 221 index line last Monday (11/15/21) at USERX 13.18. Those are the master long-term indices. The green line 92-96 index is 3rd and final resistance, see here. This past week’s decline from the 3rd resistance 92-96 index was typical. The decline may already be forming the next short-term low. USERX is already approaching the supportive 16-20 index that comes in at the prior high of USERX 12.69 (the blue index line that is topping at that 12.69). Based upon SKI, Jeff has joined the chorus of analysts seeing the set-up for a major gold stock bull market. A “set-up” is an approaching possibility and is not a prediction. The set-up could even mimic the two greatest bull markets of 1979-1980 and late 2001-2002. It’s “interesting” that the first 2 instances occurred 22 years apart and it will soon be 21 years from the second one. The set-up can initiate in December (in a few weeks from now). What’s needed next is for USERX to generate that 3rd resistance 92-96 index signal. NOTE that a rise to above the green index line is NOT a “great bullish break-out”. It is the actual mathematical 3rd resistance signal if/when USERX can soon get over the declining master green index line. The gold stocks would then need to decline back below the green AND then quickly rise back above the 92-96 index’s back prices. Can you see how it’s not difficult for USERX to get above the chart’s green line, then decline to below it, and then get back above it as the index declines via this Summer’s plunge? The last chance at a bull market occurred in March of this year as the 92-96 index re-bought, but Jeff then had to sell at the mid-May high. That set-up and execution was NOT as bullish as the approaching possibility…. Best Wishes, Jeff If you are interested in following and learning more about the SKI indices, I'll write another Report in three weeks or you can shell out the big bucks for a SKI subscription. Weekly Updates are available by subscribing for a month (or longer if you're wise and cheap enough to want to save money) at my website www.skigoldstocks.com for the princely sum of $30 (for a one month subscription) or more ($240 for an annual subscription). I also provide more frequent intra-week daily messages/alerts at a slightly higher price along with access to our informative Forum. ###  SKI archives SKI archives
email: jeff@skigoldstocks.com
Jeffrey M. Kern,Ph.D., is an academic psychologist with a specialty in the measurement and prediction of human behavior. The communications provided are for informational purposes only and are not intended to be investment advice or recommendations for specific investment decisions. Dr. Kern is not a registered investment advisor, but is registered as a commodity trading advisor (CTA). The information provided is considered accurate, but cannot be guaranteed. Investments/trading in narrow market segments or gold futures is for individuals willing to accept a higher level of risk for the opportunity of greater returns. Past performance is no guarantee of future performance. His website is www.skigoldstocks.com.
Communications should be sent to: jeff@skigoldstocks.com.
Copyright © 2002-2024 Jeffrey Kern. All Rights Reserved.
321gold Ltd

| 