 Special SKI Report #261 Special SKI Report #261
Gold Stock Update: Continued Resistances Jeffrey M. Kern, Ph.D.
Email: jeff@skigoldstocks.com
USERX | historicals
Written Sunday Oct 31, 2021
Published Nov 1, 2021 Current USERX price = 12.20, Up 71 cents (6.2%) since the last report 3 weeks ago. Introduction (repeated from prior Reports):
I have been using my unique SKI indices
to predict price changes in the precious metals' market for more
than two decades. And my indices continue to mark the critical
points. I have initiated a subscription website since 1/13/06
(yes, Friday the 13th) after having posted free updates for years
at www.321gold.com. SKI is a timing service; although
almost everyone seems to believe that market timing is impossible,
that IS what the SKI indices have done for 36 years.
The SKI indices contain short-term (16-20
trading days), intermediate-term (35-39 trading days), and long-term
(92-96 trading days) indices. A more comprehensive description
of these mathematical indices and their history is found here.
Basically, the indices compare today's price to prices from a
specified prior time period. The name of the index specifies the
time period (e.g., 92-96 index = compare today's price to prices
from 96, 95, 94, 93, and 92 trading days earlier). Although I
use the oldest gold mutual fund, USERX, for analyses, the predictions
are applicable to the broad precious metals' market. I do not
recommend or analyze specific stocks, but my subscribers from
around the world regularly discuss individual issues on our Forum.
In addition to the truly unique SKI indices, I also use "run
patterns" to guesstimate turning points in the precious metals'
market. A "run" refers to a pattern of daily up and
down market closing prices. If the market has 3 consecutive days
of higher closing prices, the run is "3 up". If prices
then decline for 2 consecutive days, the run becomes "3 up
and 2 down". If prices then close higher the next day, the
run changes to "2 down and 1 up". Some people have referred
to run patterns as "worms". A run pattern is only completed
after the direction of closing prices has changed. I have compiled
a listing of every run pattern that has ever occurred and generated
probabilities that the end of the run marks a high or a low, moderated
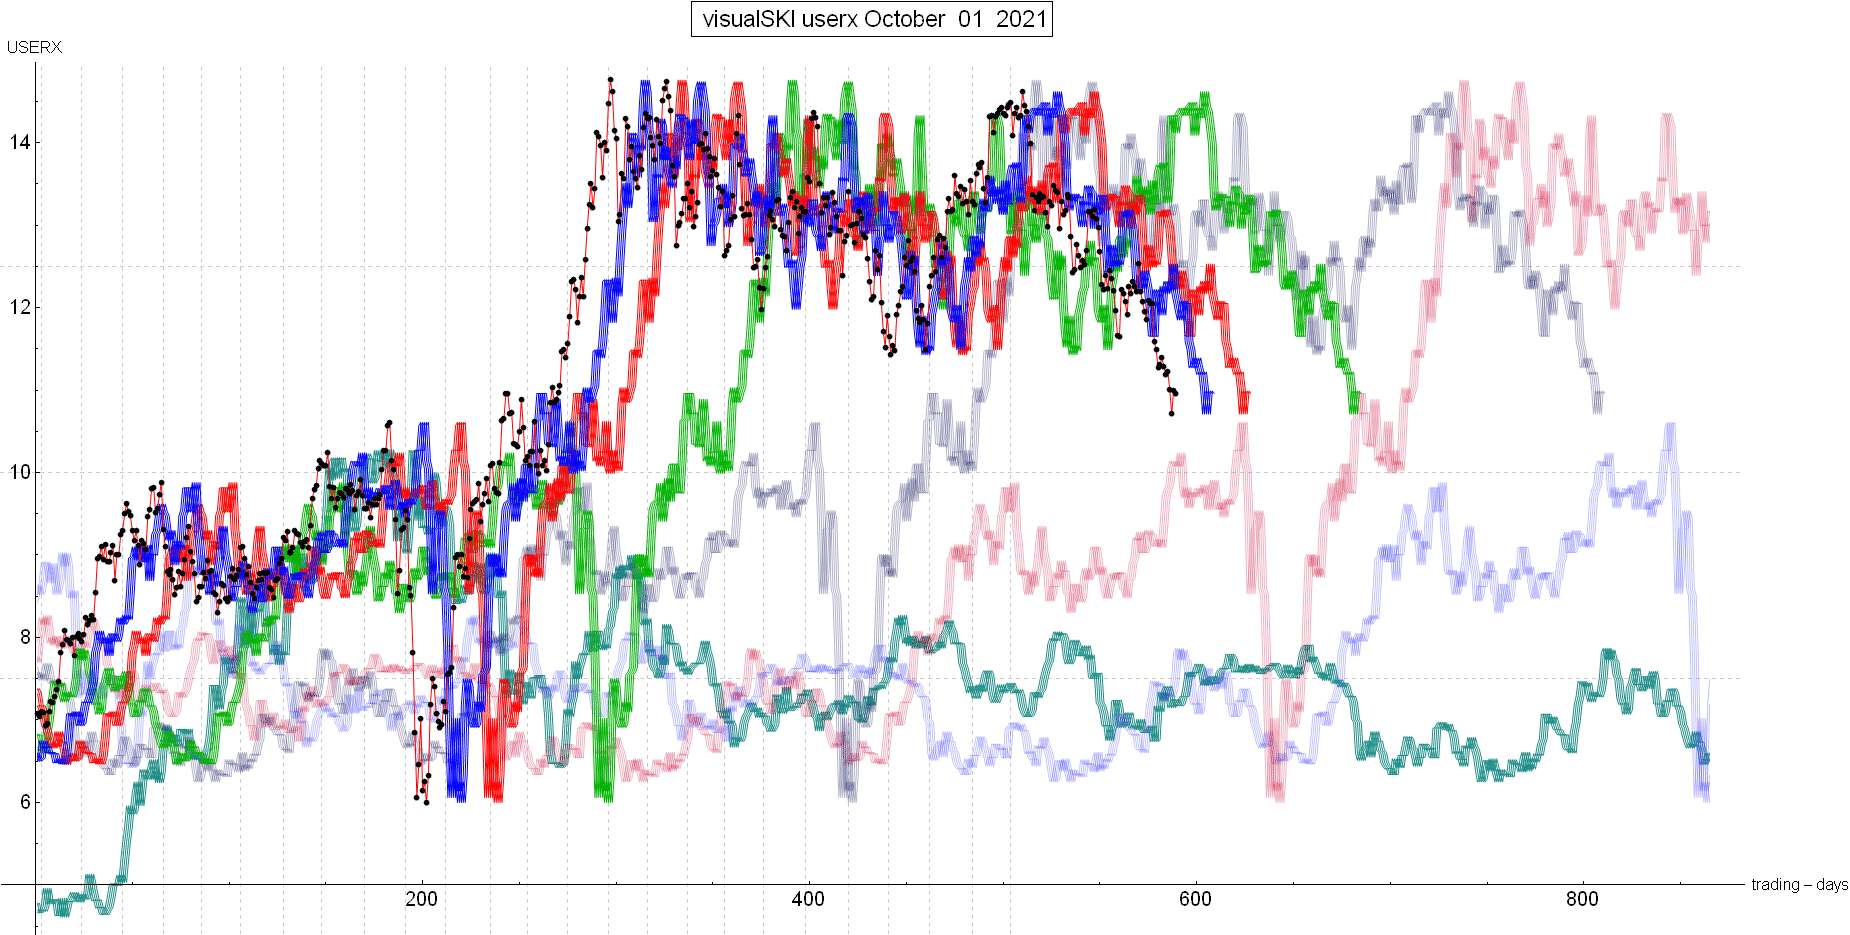
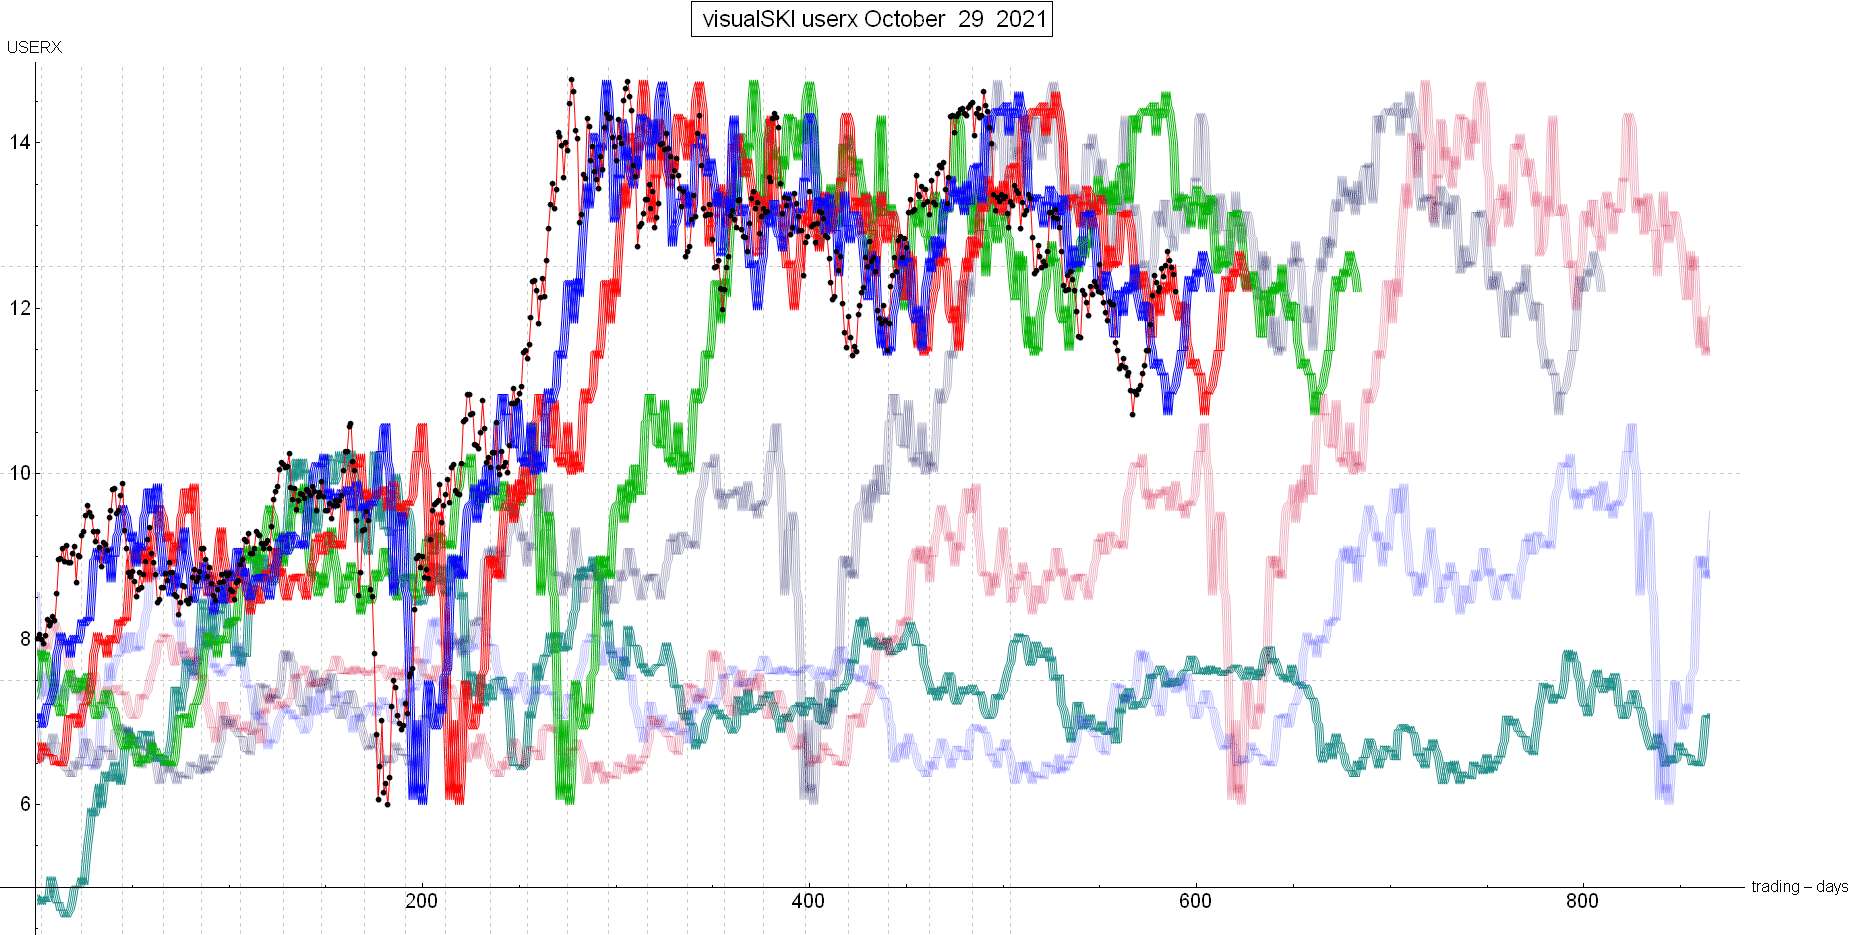
by the indices themselves. New Material I wouldn’t change one word of the Conclusions published in the last SKI Report, written on 10/10/21. It was accompanied by this chart of the indices. The black dots are USERX, the blue line is the short-term 16-20 index, and the red line is the intermediate-term 35-39 index: “The decent rise during the past 1.5 weeks is reaching index resistance(s). During the past 4 months, each rise into the overhead indices has been rejected down to a lower low. During this coming week, we’re going to see whether this bearish behavioral pattern will change. If USERX can rise above 11.59 on Thursday (10/14/21) or be above 11.49 (the current price) on Friday (10/15/21), the 16-20 index would generate its first signal in the past 4 months. It still would represent first resistance, but the bearish behavioral pattern would be changed and Mechanical SKI would get “activated” for new action. Until that happens, the gold stocks remain in an intermediate-term downtrend. The problem for the bullish case is that there’s also the 35-39 index resistance” After that Report, USERX was UNchanged the next day (10/11/21) as the important Canadian market was on holiday/closed. USERX’s closing price of 12.49 EXACTLY hit/touched the 16-20 index’s resistance at 11.49. It had risen for an extended/”stretched” 6 consecutive days. The 90+% historical probability was that the run higher would end via a decline the next day. That was “the” technical point, but the gold stocks surged higher for another 3(!!!) consecutive days. USERX’s run higher extended to an extra-extreme (3+ standard deviation) 9 trading days! (I dislike exclamation points but this was rare). USERX has only risen ONE time since 1974 to 10 consecutive trading days. And yes, Jeff personally remained in rotten cash…. The rise triggered the 16-20 index AND 35-39 index signals described in the prior Report. USERX rose to above the blue line 16-20 index into 10/14/21 at 12.39. It also rose to above the red line 35-39 the next day. Here’s the current SKI index chart. Again, the black dots are the USERX price. These 2 almost simultaneous index signals are historically common and represent the indices marking 1st and 2nd resistance. But they also “activated SKI” for potential buy signals on declines. The rise actually continued into this past Monday (10/25/21) at USERX 12.69. The rise went exactly into the next resistance 221 index (the faded purple line) that was bottoming at exactly … 12.69 … from 12/14/2020. The rise yielded a bearish USERX run pattern, and 2 (80% probability) bearish indicators for gold bullion that both “worked”. In conclusion, the gold stocks rose into multiple index resistances. Based upon multi-decade SKI history, the short-term (not necessarily tomorrow) is bearish. That does not mean an imminent “crash” but at least sideways-down. There are multiple potential Mechanical SKI buy-points because SKI has been “activated”. I’d love to detail such bullish scenarios (or the really bearish one). That’s just “too much” as SKI can yield multiple new index signals during the next 1-2 weeks. As of now, Jeff remains “patient” and conservative. Join us. Best Wishes, Jeff If you are interested in following and learning more about the SKI indices, I'll write another Report in three weeks or you can shell out the big bucks for a SKI subscription. Weekly Updates are available by subscribing for a month (or longer if you're wise and cheap enough to want to save money) at my website www.skigoldstocks.com for the princely sum of $30 (for a one month subscription) or more ($240 for an annual subscription). I also provide more frequent intra-week daily messages/alerts at a slightly higher price along with access to our informative Forum. ###  SKI archives SKI archives
email: jeff@skigoldstocks.com
Jeffrey M. Kern,Ph.D., is an academic psychologist with a specialty in the measurement and prediction of human behavior. The communications provided are for informational purposes only and are not intended to be investment advice or recommendations for specific investment decisions. Dr. Kern is not a registered investment advisor, but is registered as a commodity trading advisor (CTA). The information provided is considered accurate, but cannot be guaranteed. Investments/trading in narrow market segments or gold futures is for individuals willing to accept a higher level of risk for the opportunity of greater returns. Past performance is no guarantee of future performance. His website is www.skigoldstocks.com.
Communications should be sent to: jeff@skigoldstocks.com.
Copyright © 2002-2024 Jeffrey Kern. All Rights Reserved.
321gold Ltd

| 