 Special SKI Report #228 Special SKI Report #228
Gold Stock Bull Intact But Threatened Jeffrey M. Kern, Ph.D.
Email: jeff@skigoldstocks.com
USERX | historicals
Written Sunday Nov 17, 2019
Published Nov 18, 2019 Current USERX price = 8.70, Down 14 cents (1.6%) since the last report 3 weeks ago. Introduction (repeated from prior Reports):
I have been using my unique SKI indices
to predict price changes in the precious metals' market for more
than two decades. And my indices continue to mark the critical
points. I have initiated a subscription website since 1/13/06
(yes, Friday the 13th) after having posted free updates for years
at www.321gold.com. SKI is a timing service; although
almost everyone seems to believe that market timing is impossible,
that IS what the SKI indices have done for 36 years.
The SKI indices contain short-term (16-20
trading days), intermediate-term (35-39 trading days), and long-term
(92-96 trading days) indices. A more comprehensive description
of these mathematical indices and their history is found here.
Basically, the indices compare today's price to prices from a
specified prior time period. The name of the index specifies the
time period (e.g., 92-96 index = compare today's price to prices
from 96, 95, 94, 93, and 92 trading days earlier). Although I
use the oldest gold mutual fund, USERX, for analyses, the predictions
are applicable to the broad precious metals' market. I do not
recommend or analyze specific stocks, but my subscribers from
around the world regularly discuss individual issues on our Forum.
In addition to the truly unique SKI indices, I also use "run
patterns" to guesstimate turning points in the precious metals'
market. A "run" refers to a pattern of daily up and
down market closing prices. If the market has 3 consecutive days
of higher closing prices, the run is "3 up". If prices
then decline for 2 consecutive days, the run becomes "3 up
and 2 down". If prices then close higher the next day, the
run changes to "2 down and 1 up". Some people have referred
to run patterns as "worms". A run pattern is only completed
after the direction of closing prices has changed. I have compiled
a listing of every run pattern that has ever occurred and generated
probabilities that the end of the run marks a high or a low, moderated
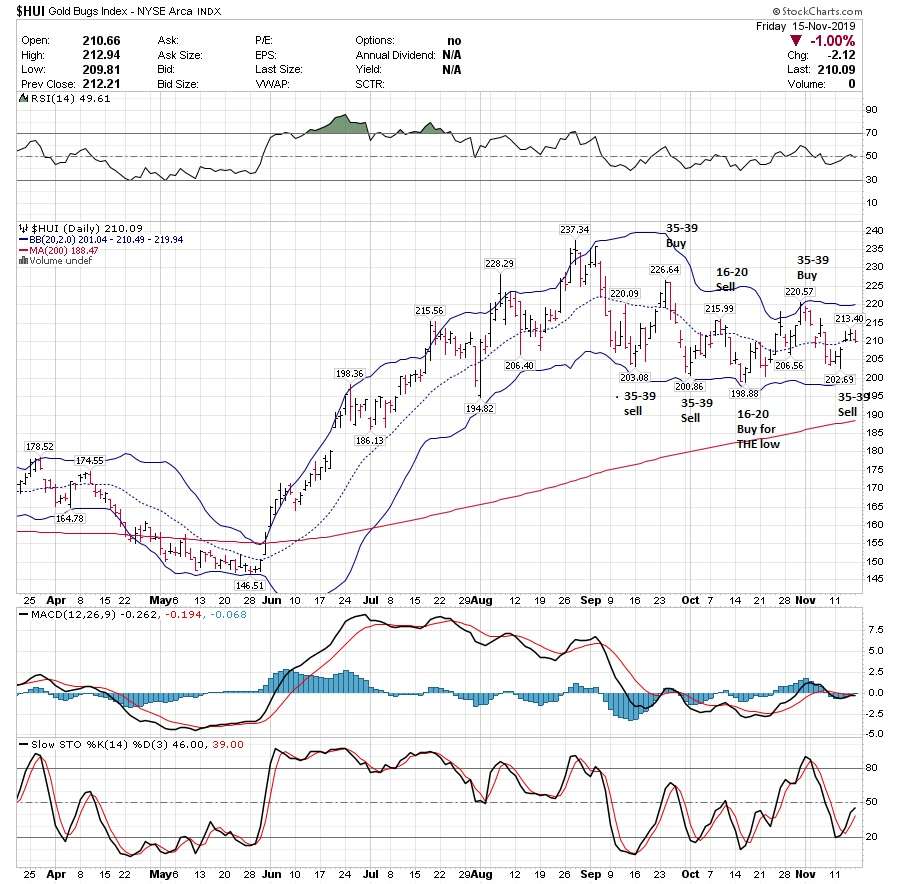
by the indices themselves. New Material The last SKI Report, written on Sunday, 10/27/19, described how the SKI indices on USERX (and the HUI, almost simultaneously) continued to mark the technical spots. The SKI-defined bull market (based upon master 92-96 index and 221 index buy signals) from June was intact. More importantly, that Update emphasized the boldfaced prediction that the 16-20 index’s buy signal (that occur on declines) had generated on “10/15/19 for execution the next day. This buy signal was historically and SKI-theoretically ‘supposed to’ mark the final corrective low within an on-going bull market”.That low was at USERX 8.30 (HUI 199.12). The Update also boldfaced that the gold stocks should continue to rise in the short-term to a 16-20 index sell signal and then continue higher to another 35-39 index buy signal (above the prices from 35-39 trading days earlier). That’s what happened. USERX (and the HUI) rose to a 35-39 index buy signal that generated on the exact high of 9.10 on 11/01/19, executing one day later. That turned out to be another HIGH. The indices had once again marked the exact “technical spot” to within one trading day.Here’s a HUI chart showing the index signals over the past two months of decline/”correction”: https://imagizer.imageshack.com/img922/8563/fb4ZfT.jpg (click the image to enlarge it). Jeff thought that the 11/01/19 35-39 index signal would finally be intermediate-term (multi-month) BULLISH because a bull market MUST eventually generate a 35-39 index buy signal AND keep rising. I was wrong. The gold stocks declined into the above chart’s 35-39 index sell signal that marked ths past Monday-Tuesday (11/11/19-11/12/19) as the next quick “technical spot". Note that 11/11/19 was the closing low for the gold stocks and then Tuesday manifested a new intra-day low with a traditionally bullish “reversal” into a higher close. Now, the next index signal needs to be a 3rd 35-39 index buy signal. And this next one needs to yield a continuing rise. USERX needs to get/stay above the following prices to generate the index’s next buy signal during this coming week: | Monday (11/18/19): | 9.35, 9.04, 8.92, 8.78, 8.44 | | Tuesday (11/19/19): | 9.04, 8.92, 8.78, 8.44, 8.48 | | Wednesday (11/20/19): | 8.92, 8.78, 8.44, 8.48, 8.62 | | Thursday (11/21/19): | 8.78, 8.44, 8.48, 8.62, 8.62 | | Friday (11/22/19): | 8.44, 8.48, 8.62, 8.62, 8.79 | USERX and the HUI HAVE remained above their 10/15/19 lows, as predicted even though GDX and Gold made a slight NEW low on last week’s 35-39 index signal. But the bull market is being threatened as TIME is running out for the master 92-96 index. Look at the prices from 92-96 trading days ago. They are rising. The continuing SKI-bull market needs for USERX to remain ABOVE those rising prices from 92-96 trading days earlier. The bull needs USERX (and HUI) to generate the new 35-39 index buy signal soon and to be at least 4% higher (from today’s price) in 7-11 trading days to stay above the prices from 92-96 trading days earlier… Seriously. Best Wishes, Jeff If you are interested in following and learning more about the SKI indices, I'll write another Report in three weeks or you can shell out the big bucks for a SKI subscription. Weekly Updates are available by subscribing for a month (or longer if you're wise and cheap enough to want to save money) at my website www.skigoldstocks.com for the princely sum of $30 (for a one month subscription) or more ($240 for an annual subscription). I also provide more frequent intra-week daily messages/alerts at a slightly higher price along with access to our informative Forum. ###  SKI archives SKI archives
email: jeff@skigoldstocks.com
Jeffrey M. Kern,Ph.D., is an academic psychologist with a specialty in the measurement and prediction of human behavior. The communications provided are for informational purposes only and are not intended to be investment advice or recommendations for specific investment decisions. Dr. Kern is not a registered investment advisor, but is registered as a commodity trading advisor (CTA). The information provided is considered accurate, but cannot be guaranteed. Investments/trading in narrow market segments or gold futures is for individuals willing to accept a higher level of risk for the opportunity of greater returns. Past performance is no guarantee of future performance. His website is www.skigoldstocks.com.
Communications should be sent to: jeff@skigoldstocks.com.
Copyright © 2002-2024 Jeffrey Kern. All Rights Reserved. 321gold Ltd

|
