 Special SKI Report #160 Special SKI Report #160
Gold Stock Update: Still Bullish Jeffrey M. Kern, Ph.D.
Email: jeff@skigoldstocks.com
USERX | historicals
Written Sunday Oct 18, 2015
Published Oct 19, 2015 Current USERX price = 5.50, Up 53 cents (11%) since the last report 4 weeks ago. Introduction (repeated from prior Reports):
I have been using my unique SKI indices
to predict price changes in the precious metals' market for more
than two decades. And my indices continue to mark the critical
points. I have initiated a subscription website since 1/13/06
(yes, Friday the 13th) after having posted free updates for years
at www.321gold.com. SKI is a timing service; although
almost everyone seems to believe that market timing is impossible,
that IS what the SKI indices have done for 36 years.
The SKI indices contain short-term (16-20
trading days), intermediate-term (35-39 trading days), and long-term
(92-96 trading days) indices. A more comprehensive description
of these mathematical indices and their history is found here.
Basically, the indices compare today's price to prices from a
specified prior time period. The name of the index specifies the
time period (e.g., 92-96 index = compare today's price to prices
from 96, 95, 94, 93, and 92 trading days earlier). Although I
use the oldest gold mutual fund, USERX, for analyses, the predictions
are applicable to the broad precious metals' market. I do not
recommend or analyze specific stocks, but my subscribers from
around the world regularly discuss individual issues on our Forum.
In addition to the truly unique SKI indices, I also use "run
patterns" to guesstimate turning points in the precious metals'
market. A "run" refers to a pattern of daily up and
down market closing prices. If the market has 3 consecutive days
of higher closing prices, the run is "3 up". If prices
then decline for 2 consecutive days, the run becomes "3 up
and 2 down". If prices then close higher the next day, the
run changes to "2 down and 1 up". Some people have referred
to run patterns as "worms". A run pattern is only completed
after the direction of closing prices has changed. I have compiled
a listing of every run pattern that has ever occurred and generated
probabilities that the end of the run marks a high or a low, moderated
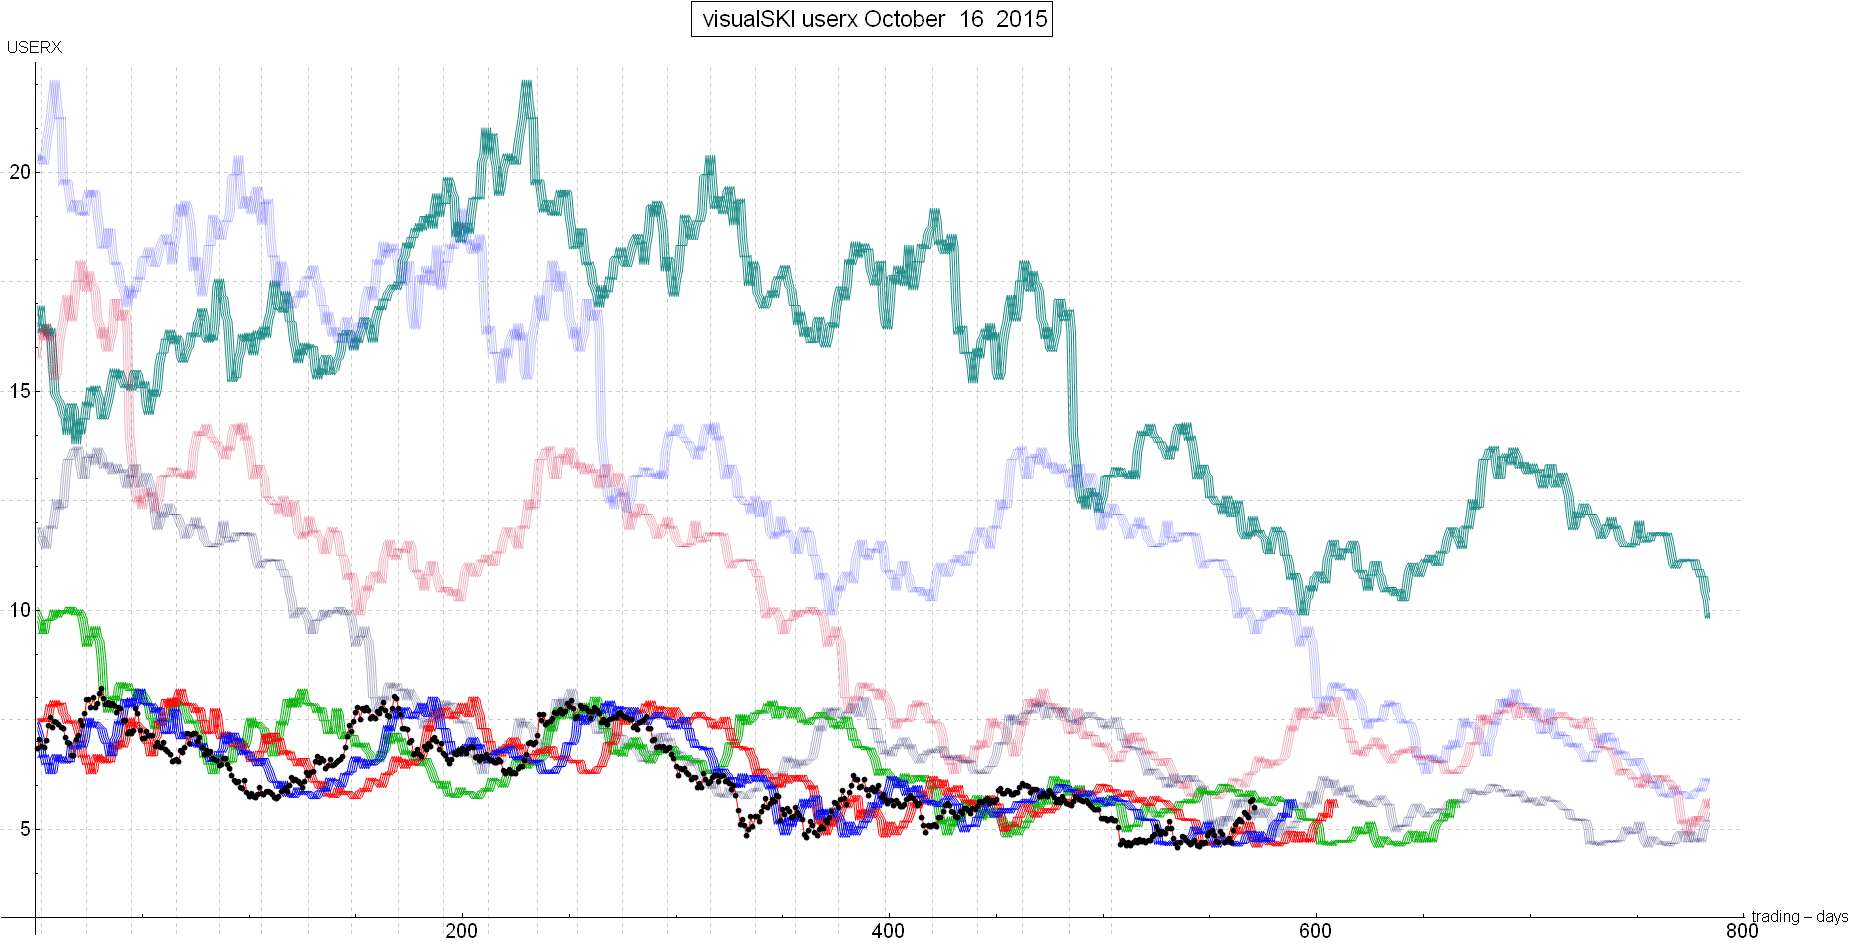
by the indices themselves. New Material The last gold stock SKI Report, written on Sunday 9/20/15, described how the gold stocks (USERX) had generated a 16-20 index buy signal and then a 35-39 index buy signal for a “Double Buy” that projected a rise over one month. But the important point was that resistance was being hit/touched from the long-term 221 index and the short-term 16-20 index’s sell signal and that a significant decline was likely IF the sell-stop was activated. In the week after that Report, the gold stocks gyrated down and then back up to hit/touch the 221 index again on 9/24/15 at USERX 4.96. And then they declined again into 10/01/15. That decline was sufficient to generate a 35-39 index sell signal that executed on 10/02/15. Fortunately, the gold stocks surged 7% on 10/02/15, so the index sold at a small profit. More importantly that 10/02/15 surge higher caused the 35-39 index to be back to within one day of REBUYING. And when the gold stocks didn’t decline 2% on the next trading day (10/05/15), the 35-39 index generated its new buy signal. Therefore, the index (SKI and Jeff) was whipsawed for a day. The renewed buy signal once again projected a rise to the long-term indices (the 221 index and the 92-96 index). Here’s a complimentary chart of the SKI indices. The red line is the 35-39 index, the green line is the 92-96 index, and the faded purple line is the 221 index. Note how prices have risen strongly since USERX went over the red line on 10/05/15. USERX has now risen just over the faded purple line for a very long-term buy signal, and it’s just hitting/touching the green line’s 92-96 index major resistance. SKI bull markets require that USERX rise over the 221 index (done!) and rise over the 92-96 index (not quite yet). Then the gold stocks would need to decline to back below the green line for a 92-96 index sell signal. Such a sell signal would not guarantee bullishness (at all), but a subsequent brief rise back over the 92-96 index (at around the current price level) WOULD complete the signals that are required for the beginning of a true bull market (a 100-500% USERX rise over 1-3+ years). Conclusion We’ve gotten the rise into the long-term SKI indices that are resistance. SKI remains bullish and, based upon the history of such buy signals is looking for a specific time and price target that is approaching and should be reached before the next 321gold SKI Report. I canNOT yet state that a bull market has begun: A decline back below the SKI chart’s faded purple long-term 221 index line would strongly suggest “a failure for the bulls”. But if USERX can rise some more here and THEN decline, the set-up for a bull market would continue to develop. As per the SKI Report from a month ago, the system is still bullish with a rather close sell-stop. Best Wishes, Jeff If you are interested in following and learning more about the SKI indices, I'll write another Report in three weeks or you can shell out the big bucks for a SKI subscription. Weekly Updates are available by subscribing for a month (or longer if you're wise and cheap enough to want to save money) at my website www.skigoldstocks.com for the princely sum of $25 (for a one month subscription) or more ($200 for an annual subscription). I also provide more frequent intra-week messages/alerts at a slightly higher price along with access to our informative Forum and a managed gold futures program. The precious metals are in a very long-term (decade+) up-trend but are the most precarious, volatile, and psychologically difficult market in the world (in my opinion). That's the way it's always been. ###  SKI archives SKI archives
email: jeff@skigoldstocks.com
Jeffrey M. Kern,Ph.D., is an academic psychologist with a specialty in the measurement and prediction of human behavior. The communications provided are for informational purposes only and are not intended to be investment advice or recommendations for specific investment decisions. Dr. Kern is not a registered investment advisor, but is registered as a commodity trading advisor (CTA). The information provided is considered accurate, but cannot be guaranteed. Investments/trading in narrow market segments or gold futures is for individuals willing to accept a higher level of risk for the opportunity of greater returns. Past performance is no guarantee of future performance. His website is www.skigoldstocks.com.
Communications should be sent to: jeff@skigoldstocks.com.
Copyright © 2002-2024 Jeffrey Kern. All Rights Reserved. 321gold Ltd

| 