 Special SKI Report #278 Special SKI Report #278
Gold Stock Update Jeffrey M. Kern, Ph.D.
Email: jeff@skigoldstocks.com
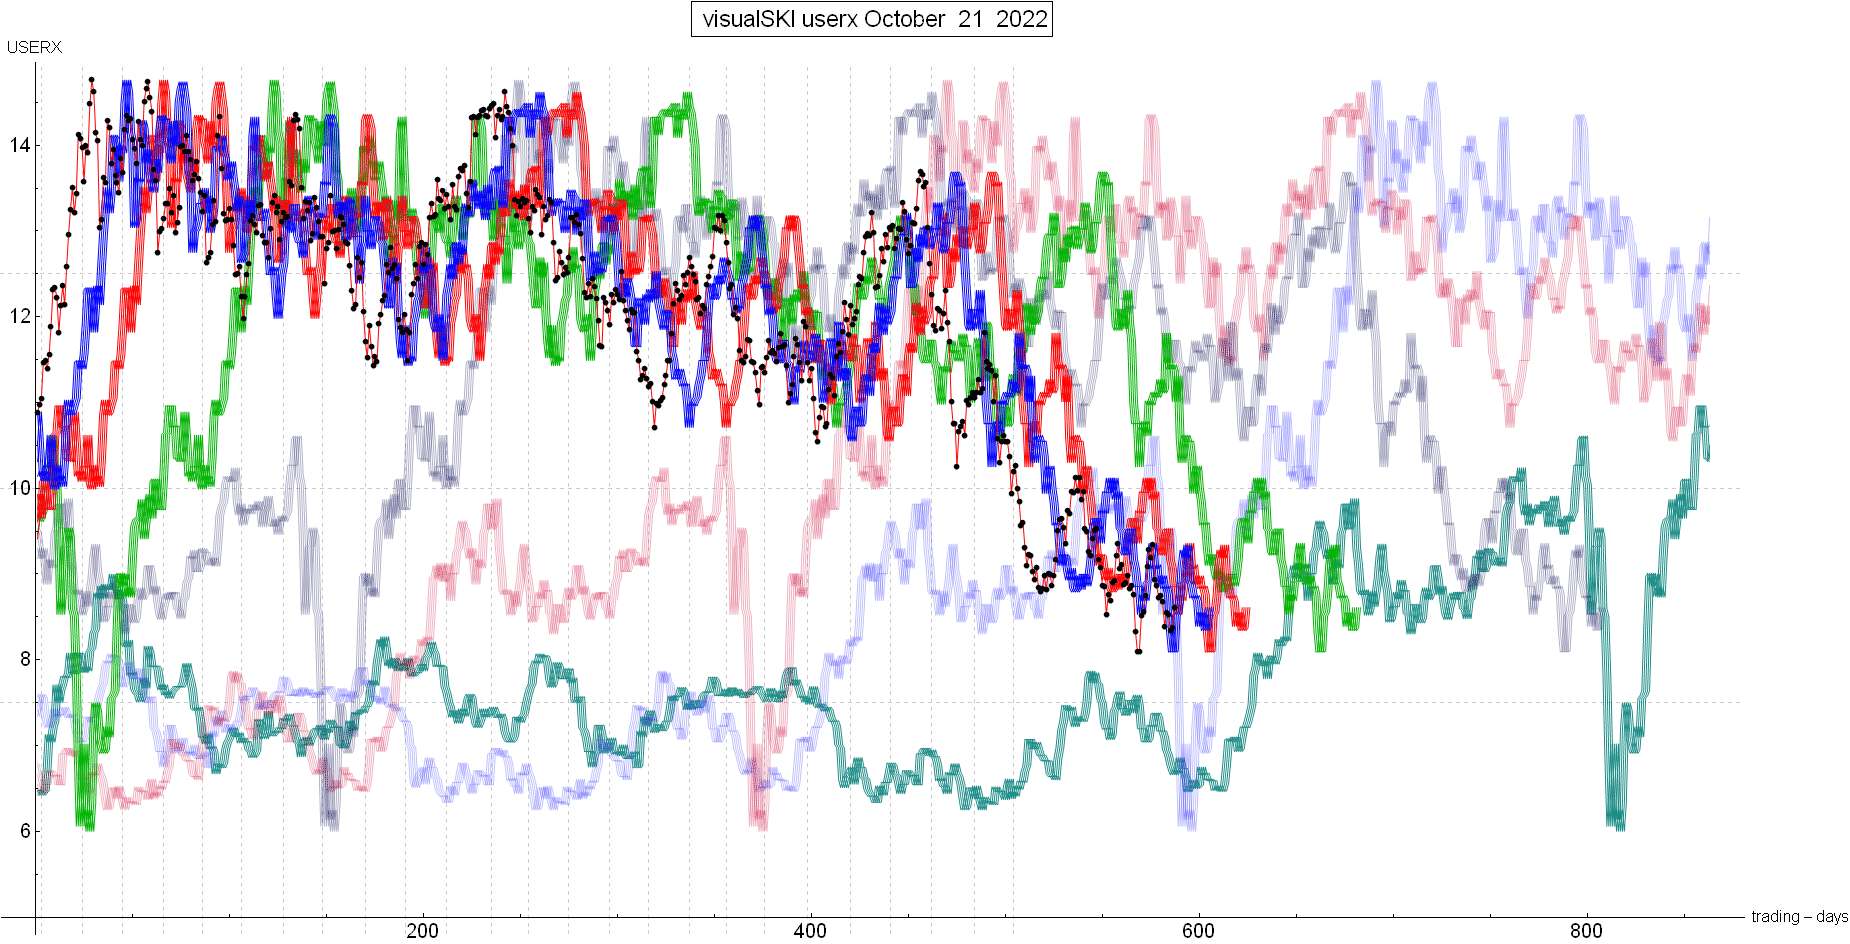
USERX | historicals
Written Sunday Oct 23, 2022
Published Oct 24, 2022 Current USERX price = 8.61, Down 14 cents (1.6%) since the last report 3 weeks ago. Introduction (repeated from prior Reports):
I have been using my unique SKI indices
to predict price changes in the precious metals' market for more
than two decades. And my indices continue to mark the critical
points. I have initiated a subscription website since 1/13/06
(yes, Friday the 13th) after having posted free updates for years
at www.321gold.com. SKI is a timing service; although
almost everyone seems to believe that market timing is impossible,
that IS what the SKI indices have done for 36 years.
The SKI indices contain short-term (16-20
trading days), intermediate-term (35-39 trading days), and long-term
(92-96 trading days) indices. A more comprehensive description
of these mathematical indices and their history is found here.
Basically, the indices compare today's price to prices from a
specified prior time period. The name of the index specifies the
time period (e.g., 92-96 index = compare today's price to prices
from 96, 95, 94, 93, and 92 trading days earlier). Although I
use the oldest gold mutual fund, USERX, for analyses, the predictions
are applicable to the broad precious metals' market. I do not
recommend or analyze specific stocks, but my subscribers from
around the world regularly discuss individual issues on our Forum.
In addition to the truly unique SKI indices, I also use "run
patterns" to guesstimate turning points in the precious metals'
market. A "run" refers to a pattern of daily up and
down market closing prices. If the market has 3 consecutive days
of higher closing prices, the run is "3 up". If prices
then decline for 2 consecutive days, the run becomes "3 up
and 2 down". If prices then close higher the next day, the
run changes to "2 down and 1 up". Some people have referred
to run patterns as "worms". A run pattern is only completed
after the direction of closing prices has changed. I have compiled
a listing of every run pattern that has ever occurred and generated
probabilities that the end of the run marks a high or a low, moderated
by the indices themselves. New Material
The last SKI Report, written on 10/02/22, the gold stocks had surged higher from the 9/26/22 low at USERX 8.09 (a new 2022 low with extremely oversold sentiment) for 4 consecutive days. The rise was hitting/touching the first resistance 16-20 index. Jeff didn’t really have a forecast. Bulls needed a rise to above that rising 16-20 index and then to above the next resistance index (the 35-39 index) that was also. That would be difficult. A large plunge was possible because the SKI long-term 663-day index was about to plunge to the March 2020 COVID low. That index is contrarian (i.e., it buys on declines, as it did at that COVID-low). Immediately after that Report, the gold stocks surged higher for another 2 trading days to USERX 9.28. The rise DID get above the 16-20 index to help the bullish case, but the 16-20 index did generate its first resistance sell signal on that day. Importantly, the USERX run pattern was at 3 days down and then 6 days up. The 6-day rise was strong, averaging 2.5% a day for 6 days. That run pattern only occurs approximately once every 2 years since 1974. It has an 80% probability of marking a Low AND a High. One only knows about the low after-the-fact (after the run higher has already occurred). But we then “knew” (80% probability) that 10/04/22 was likely to be a high at USERX 9.28. Plus, there was the 16-20 index’s sell signal. And that was a high. As the gold stocks declined into last weekend, the Saturday (10/15/22) SKI Update provided both the bearish and the bullish scenarios. The bearish scenario continued to be a plunge down to a 663 index buy signal at USERX $6-$7. The bullish scenario was that the gold stocks were in the process of declining to form the Right Shoulder Low of a Head @ Shoulders bottom. The Left Shoulder was at 8.53 on 9/01/22 that yielded the rise to a 9.36 high marked by a 35-39 index signal described in the last public Update. The subsequent decline to 9/26/22 was the Head (low) at USERX 8.09. We know that ensuing 6-day rise to USERX 9.28 marked the next high. And now the Right Shoulder would form at above USERX 8.09. The “neckline” of the Head @ Shoulders pattern would be the prior highs at USERX 9.36 and 9.28. The bullish scenario needed USERX to stay above 8.33 in order to get back over the 16-20 index. During this past week, that index’s back prices were at that 9/26/22 low (the “Head”) of 8.33, 8.09, 8.10, 8.51, and 8.56. When USERX closed at 8.34 on Wednesday (1-penny above 8.33) and then barely held on a 3-cent rise to 8.37 on Thursday, Friday was expected to be “the important day” for either a bullish rise to above the 16-20 index or a bearish decline to below 8.33 (and likely below 8.09). The gold stocks were declining 1.5% during Friday’s pre-market and a continuation would have been quite bearish, but the decline was reversed prior to the market open and kept going. The media attributed the early reversal to statements by a member of the U.S. Federal Reserve favoring a slower pace for future interest rate increases. Whatever the “reason”, Friday’s rise to USERX 8.61 got above the 16-20 index (the blue line in the SKI chart) because the index’s back prices were at 8.33, 8.09, 8.10, 8.51, and 8.56. Remember (from above), that bulls also then “need” USERX to get above the red line 35-39 index (which it did not do the last time it got above the 16-20 index for a run pattern high at 9.28). Friday’s rise ALSO began to get above the 35-39 index! The black dots are the USERX prices. See chart here. NOTE THAT THE BLUE 16-20 INDEX LINE IS NOW RISING TO ITS NECKLINE OF USERX 9.28 and THE BLUE LINE IS ABOUT TO RISE TO ITS NECKLINE OF USERX 9.36. In conclusion, it isn’t a “coincidence” that the 16-20 index and the 35-39 index are simultaneously rising to their neckline highs. And those highs will coincide with the next U.S. Federal Reserve announcement on 11/02/22. The now-favored bullish scenario/expectation needs/requires USERX to rise fast enough to stay above those indices’ rising back prices. So, SKI and the bulls need at least about a further approximate 8% rise during the next about 8 trading days. Chartists would/will say that USERX needs to “break out” above the neckline of the potential Head @ Shoulders bottom pattern. SKI should/will mark that break-out or a failure if the rise doesn’t continue AND continue quickly enough to stay above those indices. If the “break-out” does occur, it usually yields some “consolidation” via sideways/down and then a rise to the master 92-96 index’s (the declining green line’s) “impenetrable” resistance. Yes, that would be extremely likely to mark a high, but it would constitute the first/needed step towards a major (true SKI) bull market set-up… Best Wishes, Jeff If you are interested in following and learning more about the SKI indices, I'll write another Report in three weeks or you can shell out the big bucks for a SKI subscription. Weekly Updates are available by subscribing for a month (or longer if you're wise and cheap enough to want to save money) at my website www.skigoldstocks.com for the princely sum of $30 (for a one month subscription) or more ($240 for an annual subscription). I also provide more frequent intra-week daily messages/alerts at a slightly higher price along with access to our informative Forum. ###  SKI archives SKI archives
email: jeff@skigoldstocks.com
Jeffrey M. Kern,Ph.D., is an academic psychologist with a specialty in the measurement and prediction of human behavior. The communications provided are for informational purposes only and are not intended to be investment advice or recommendations for specific investment decisions. Dr. Kern is not a registered investment advisor, but is registered as a commodity trading advisor (CTA). The information provided is considered accurate, but cannot be guaranteed. Investments/trading in narrow market segments or gold futures is for individuals willing to accept a higher level of risk for the opportunity of greater returns. Past performance is no guarantee of future performance. His website is www.skigoldstocks.com.
Communications should be sent to: jeff@skigoldstocks.com.
Copyright © 2002-2024 Jeffrey Kern. All Rights Reserved.
321gold Ltd

| 