 Special SKI Report #277 Special SKI Report #277
Gold Stock Update Jeffrey M. Kern, Ph.D.
Email: jeff@skigoldstocks.com
USERX | historicals
Written Sunday Oct 2, 2022
Published Oct 3, 2022 Current USERX price = 8.75, Down 47 cents (5.1%) since the last report 3 weeks ago. Introduction (repeated from prior Reports):
I have been using my unique SKI indices
to predict price changes in the precious metals' market for more
than two decades. And my indices continue to mark the critical
points. I have initiated a subscription website since 1/13/06
(yes, Friday the 13th) after having posted free updates for years
at www.321gold.com. SKI is a timing service; although
almost everyone seems to believe that market timing is impossible,
that IS what the SKI indices have done for 36 years.
The SKI indices contain short-term (16-20
trading days), intermediate-term (35-39 trading days), and long-term
(92-96 trading days) indices. A more comprehensive description
of these mathematical indices and their history is found here.
Basically, the indices compare today's price to prices from a
specified prior time period. The name of the index specifies the
time period (e.g., 92-96 index = compare today's price to prices
from 96, 95, 94, 93, and 92 trading days earlier). Although I
use the oldest gold mutual fund, USERX, for analyses, the predictions
are applicable to the broad precious metals' market. I do not
recommend or analyze specific stocks, but my subscribers from
around the world regularly discuss individual issues on our Forum.
In addition to the truly unique SKI indices, I also use "run
patterns" to guesstimate turning points in the precious metals'
market. A "run" refers to a pattern of daily up and
down market closing prices. If the market has 3 consecutive days
of higher closing prices, the run is "3 up". If prices
then decline for 2 consecutive days, the run becomes "3 up
and 2 down". If prices then close higher the next day, the
run changes to "2 down and 1 up". Some people have referred
to run patterns as "worms". A run pattern is only completed
after the direction of closing prices has changed. I have compiled
a listing of every run pattern that has ever occurred and generated
probabilities that the end of the run marks a high or a low, moderated
by the indices themselves. New Material
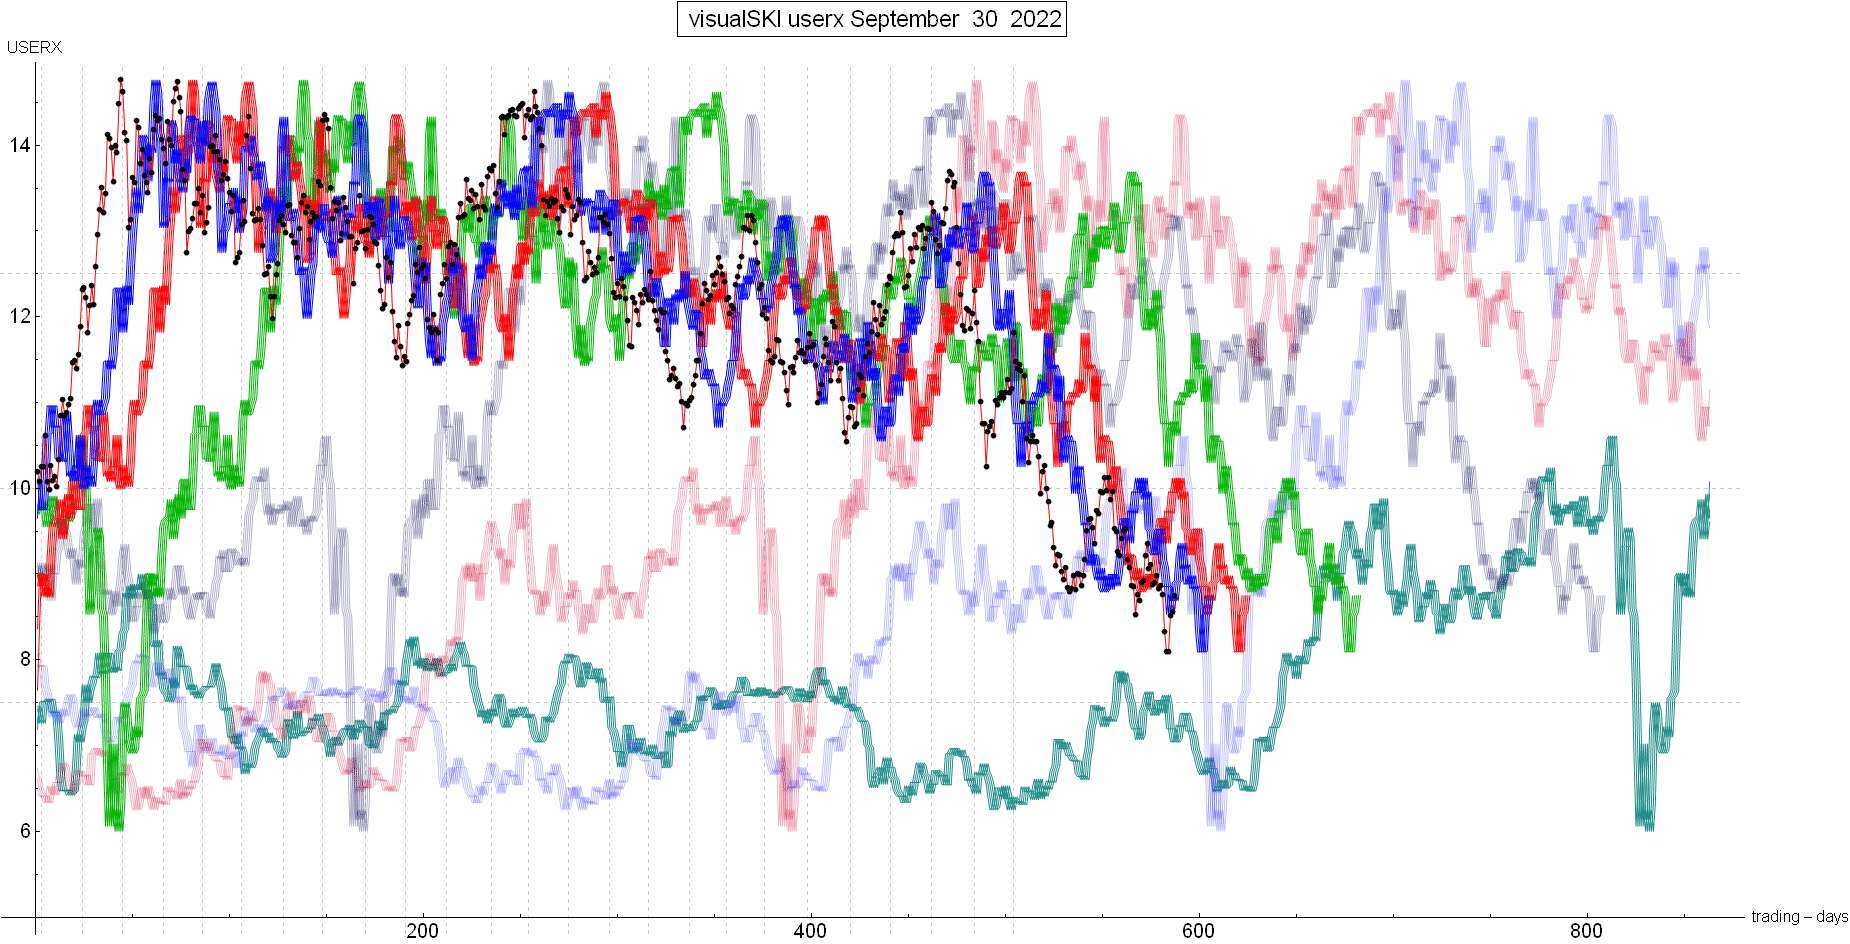
The last SKI Report, written on 9/11/22, described how the gold stocks (USERX) had risen from a low on 9/01/22 (at USERX 8.53) to go above the prices from 35-39 trading days earlier. The rise had finally generated a 35-39 index buy signal for execution on 9/12/22. The buy signal was supposed to be bullish, but prediction wasn’t really necessary. The bold-faced conclusions section stated, “That red 35-39 index line is at its late July low and is RISING. Therefore, all that matters is whether USERX rises enough over the next few weeks to stay above the rising prices from 35-39 trading days earlier". A failure to rise enough over the next few weeks would yield a 35-39 index sell signal, stop-out Mechanical SKI + Jeff, and be potentially very bearish. What happened? The gold stocks rose into the 35-39 index’s buy signal on Monday 9/12/22. Mechanical SKI bought and Jeff executed a mild 25% long position at USERX 9.36. That turned out to be an EXACT high. The index signal had once again marked an exact technical (Price X Time) point, but the all-important direction was WRONG. The volatile gold stocks dropped 3% the next day and Jeff INcorrectly bought a little more. As the gold stocks went sideways/down for a few more days, USERX began to hit/touch the 35-39 index towards its sell-stop sell signal. On Monday (9/09/22), USERX needed to rise just 1%, to above 8.98, to avoid generating that sell signal. Despite a 2.5% rise in the HUI, USERX only rose to exactly 8.98. Once again, that demonstrated how USERX is the most valid/best measure because USERX incorporates worldwide gold stocks (Australia, Canada, the U.S., etc.) AND the movement of non-U.S. currencies (mainly the Australian and Canadian Dollars, “commodity currencies”). Therefore, the 35-39 index generated its mathematical sell-stop sell signal as USERX couldn’t stay above the index’s rising back prices that were at 8.86, 8.98, 9.17, 9.51,and 9.64. Personally, Jeff doesn’t expend all this research and time to buy/sell the gold stocks with a small amount. My 100% long position uses approximately 40% of my net worth. So my 25+% long position was relatively small, but was still 10% of my net worth. It wasn’t pleasant, but there’s rarely a year that goes by without one or several losses. The long-term key is to have an objective sell-stop and execute it so as to avoid a large loss. It’s almost a pleasure to write about a loss because this is reality. And then the gold stocks plunged another 10%, down to USERX 8.09, on last Monday (9/26/22) despite highly oversold sentiment indicators. The SKI Weekend Update on Saturday (9/24/22) had remained bearish but emphasized that the gold stocks could rise back to index resistance. Jeff and SKI did not buy due to the absence of an objective sell-stop, but that was quite a nice 8% rise last Tuesday-Friday. Now, the solid 4-day 8% rise up to USERX 8.75 has begun to hit/touch the first resistance 16-20 index. Although the mathematical formula for each index is more accurate/exact than the visual chart for the indices, here’s the visual presentation. As always, the black dots are the USERX price. See chart. You should be able to see how USERX has risen up to the underside of the BLUE line 16-20 index. Again, this is first resistance. Bulls need a rise to above that blue line, then the red line, etc.. Can you see how the blue index line has just bottomed and is RISING? And the red index line is rising? That makes it more difficult for the gold stocks to get above those first 2 indices. Essentially, USERX has risen to the underside of a prior low. The only indices below are the long-term 663 and 884 indices. Those indices are CONTRARIAN, meaning that they generate buy signals on declines. Those turquoise and faded blue chart lines will soon decline to the COVID-crash low area. The Australian XGD gold stock index is already below its 2020 COVID low. Will USERX, HUI, XAU, GDX, GDXJ, gold (etc.) decline despite all of the oversold sentiment indicators? Best Wishes, Jeff If you are interested in following and learning more about the SKI indices, I'll write another Report in three weeks or you can shell out the big bucks for a SKI subscription. Weekly Updates are available by subscribing for a month (or longer if you're wise and cheap enough to want to save money) at my website www.skigoldstocks.com for the princely sum of $30 (for a one month subscription) or more ($240 for an annual subscription). I also provide more frequent intra-week daily messages/alerts at a slightly higher price along with access to our informative Forum. ###  SKI archives SKI archives
email: jeff@skigoldstocks.com
Jeffrey M. Kern,Ph.D., is an academic psychologist with a specialty in the measurement and prediction of human behavior. The communications provided are for informational purposes only and are not intended to be investment advice or recommendations for specific investment decisions. Dr. Kern is not a registered investment advisor, but is registered as a commodity trading advisor (CTA). The information provided is considered accurate, but cannot be guaranteed. Investments/trading in narrow market segments or gold futures is for individuals willing to accept a higher level of risk for the opportunity of greater returns. Past performance is no guarantee of future performance. His website is www.skigoldstocks.com.
Communications should be sent to: jeff@skigoldstocks.com.
Copyright © 2002-2024 Jeffrey Kern. All Rights Reserved.
321gold Ltd

|
