 Special SKI Report #276 Special SKI Report #276
Gold Stock Update Jeffrey M. Kern, Ph.D.
Email: jeff@skigoldstocks.com
USERX | historicals
Written Sunday Sep 11, 2022
Published Sep 12, 2022 Current USERX price = 9.22, Down 4 cents (0.4%) since the last report 3 weeks ago. Introduction (repeated from prior Reports):
I have been using my unique SKI indices
to predict price changes in the precious metals' market for more
than two decades. And my indices continue to mark the critical
points. I have initiated a subscription website since 1/13/06
(yes, Friday the 13th) after having posted free updates for years
at www.321gold.com. SKI is a timing service; although
almost everyone seems to believe that market timing is impossible,
that IS what the SKI indices have done for 36 years.
The SKI indices contain short-term (16-20
trading days), intermediate-term (35-39 trading days), and long-term
(92-96 trading days) indices. A more comprehensive description
of these mathematical indices and their history is found here.
Basically, the indices compare today's price to prices from a
specified prior time period. The name of the index specifies the
time period (e.g., 92-96 index = compare today's price to prices
from 96, 95, 94, 93, and 92 trading days earlier). Although I
use the oldest gold mutual fund, USERX, for analyses, the predictions
are applicable to the broad precious metals' market. I do not
recommend or analyze specific stocks, but my subscribers from
around the world regularly discuss individual issues on our Forum.
In addition to the truly unique SKI indices, I also use "run
patterns" to guesstimate turning points in the precious metals'
market. A "run" refers to a pattern of daily up and
down market closing prices. If the market has 3 consecutive days
of higher closing prices, the run is "3 up". If prices
then decline for 2 consecutive days, the run becomes "3 up
and 2 down". If prices then close higher the next day, the
run changes to "2 down and 1 up". Some people have referred
to run patterns as "worms". A run pattern is only completed
after the direction of closing prices has changed. I have compiled
a listing of every run pattern that has ever occurred and generated
probabilities that the end of the run marks a high or a low, moderated
by the indices themselves. New Material
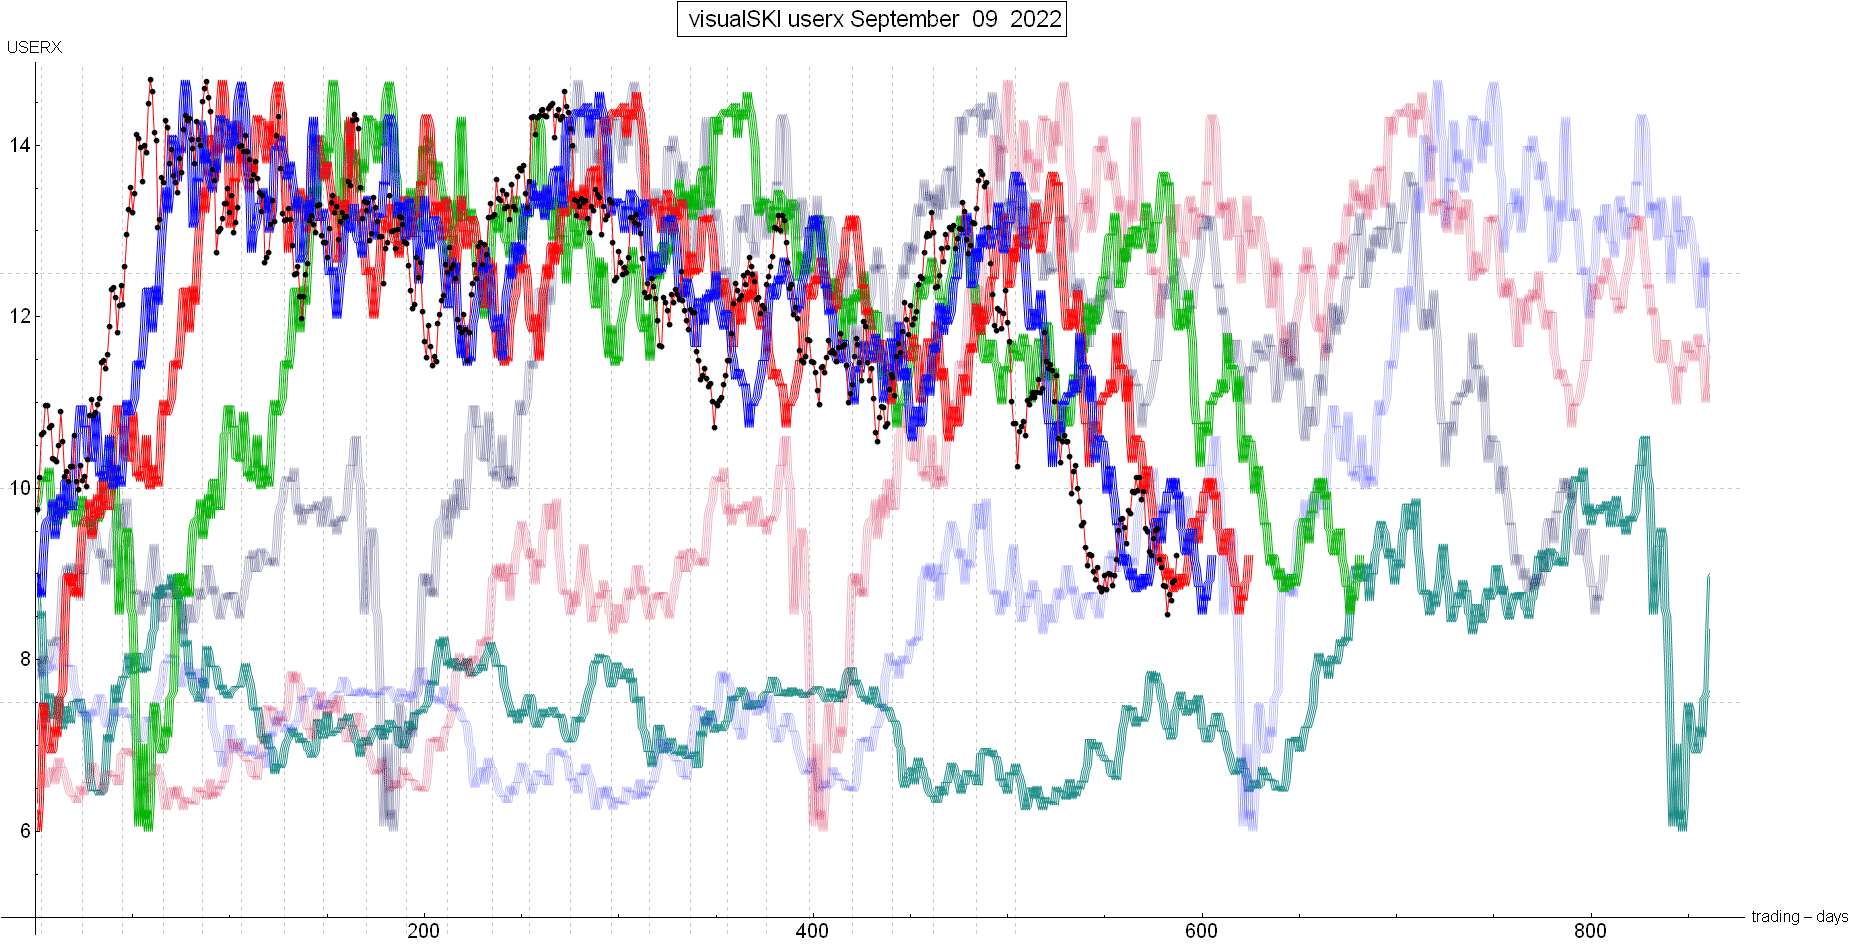
The last SKI Report, written on 8/21/22, described how the gold stocks (USERX) had continued to be bearishly rejected by the 35-39 index. USERX had dropped to a 663 index buy signal and appeared likely to continue down into a 16-20 index buy signal. The Report concluded that “The history of the indices since 1974 indicates that this second 663 index buy signal and a new 16-20 index buy signal may NOT hold here. If they do not hold as support, the gold stocks should do one additional 1-2 month (approximate) plunge into a final low. Alternatively, if a 16-20 index buy signal is followed by a brief rise above that plunging red 35-39 index line, the bullish case will renew with a rising sell-stop (the then rising red 35-39 index line). Be careful here.” The gold stocks rebounded during the next week. The modest rise to USERX 9.53 on 8/25/22 brought the 35-39 index to within 1 trading day of generating a 35-39 index buy signal that was needed for any bullish scenario. If USERX rose just another 7 cents on 8/26/22, the buy signal would generate. And the rise into 8/25/22 had been just weak enough to go below the rising 16-20 index. Therefore, the 16-20 index generated its expected and “tenuous” buy signal on 8/26/22 for execution the next day. As always, SKI index execute/mark the day after an index signal to provide a 1-day advance notice that action may be recommended/required. Prices usually decline into the execution of 16-20 index buy signals. Jeff was not recommending buying on the 8/26/22, as per the prior public Report. This review of the past 3 weeks is to once again demonstrate the technical precision of the indices (usually/often, but not “always”). The gold stocks then sharply declined on 8/26/22 into the 16-20 index’s questionable buy signal. That decline also bearishly avoided generating the “needed” (for the bulls) 35-39 index buy signal. It was a “SKI-Bingo” day. A further decline was likely due to the continuing resistance from the declining 35-39 index. And then, the gold stocks declined strongly for another 4 consecutive days to NEW MULTI-YEAR LOWS for the Australian gold stocks (XGD.ax), Canadian gold stocks, and U.S. gold stocks into Thursday, 9/01/22 at USERX 8.53. USERX’s special 3 Up and 5 down run pattern, extremely oversold sentiment indicators, and gold’s close just below the round number $1700, were all indicative of a LOW. No, Jeff and SKI did not buy that low (after having bought the prior low on 7/25/22 and then selling when the 35-39 index rejected the August rise). There wasn’t an objective index sell-stop AND there if that was a meaningful low, the declining 35-39 index would soon (finally) provide a buy signal. Now, the current chart of the indices should rather clearly show what happened since the prior SKI Report from 3 weeks ago into today, see here. Click the chart to enlarge it. Focus on the red 35-39 index line. USERX (the black dots) kept being rejected by the resistance 35-39 index. But this past week’s strong rise has blasted above the red index line for the 35-39 index’s buy signal. Therefore, Mechanical SKI and Jeff are currently back to bullishness. The likelihood is that the rise will continue. Such rises are supposed to continue to at least back above the blue index line. That would generate a first resistance 16-20 index sell signal. The gold stocks could go much higher than that over time, even up to the master green 92-96 index around USERX $12. But Jeff does not have to “predict” anything here. That red 35-39 index line is at its late July low and is RISING. Therefore, all that matters is whether USERX rises enough over the next few weeks to stay above the rising prices from 35-39 trading days earlier. With USERX currently at 9.22, it needs to rise above about 9.64 within these next 2 weeks. And then USERX would need to quickly rise to equal/surpass its 8/10/22-8/12/22 high of 10.12. The website focuses on the exact Price X Time numbers, run patterns, historical probabilities since 1974, and more (on a daily or weekly basis). A failure to rise enough over the next few weeks would yield a 35-39 index sell signal, stop-out Mechanical SKI + Jeff, and be potentially very bearish. It’s been a powerful 8% rise for USERX, and an even stronger 10% rise for the HUI during the past 5 trading days. It’s okay if USERX declines at any point to hit/touch the 35-39 index, but that index now needs to function as support, just as it acted as resistance during much of August … Best Wishes, Jeff If you are interested in following and learning more about the SKI indices, I'll write another Report in three weeks or you can shell out the big bucks for a SKI subscription. Weekly Updates are available by subscribing for a month (or longer if you're wise and cheap enough to want to save money) at my website www.skigoldstocks.com for the princely sum of $30 (for a one month subscription) or more ($240 for an annual subscription). I also provide more frequent intra-week daily messages/alerts at a slightly higher price along with access to our informative Forum. ###  SKI archives SKI archives
email: jeff@skigoldstocks.com
Jeffrey M. Kern,Ph.D., is an academic psychologist with a specialty in the measurement and prediction of human behavior. The communications provided are for informational purposes only and are not intended to be investment advice or recommendations for specific investment decisions. Dr. Kern is not a registered investment advisor, but is registered as a commodity trading advisor (CTA). The information provided is considered accurate, but cannot be guaranteed. Investments/trading in narrow market segments or gold futures is for individuals willing to accept a higher level of risk for the opportunity of greater returns. Past performance is no guarantee of future performance. His website is www.skigoldstocks.com.
Communications should be sent to: jeff@skigoldstocks.com.
Copyright © 2002-2024 Jeffrey Kern. All Rights Reserved.
321gold Ltd

|
