 Special SKI Report #259 Special SKI Report #259
Gold Stock Update Jeffrey M. Kern, Ph.D.
Email: jeff@skigoldstocks.com
USERX | historicals
Written Sunday Sep 12, 2021
Published Sep 13, 2021 Current USERX price = 11.85, Up 20 cents (1.7%) since the last report 3 weeks ago. Introduction (repeated from prior Reports):
I have been using my unique SKI indices
to predict price changes in the precious metals' market for more
than two decades. And my indices continue to mark the critical
points. I have initiated a subscription website since 1/13/06
(yes, Friday the 13th) after having posted free updates for years
at www.321gold.com. SKI is a timing service; although
almost everyone seems to believe that market timing is impossible,
that IS what the SKI indices have done for 36 years.
The SKI indices contain short-term (16-20
trading days), intermediate-term (35-39 trading days), and long-term
(92-96 trading days) indices. A more comprehensive description
of these mathematical indices and their history is found here.
Basically, the indices compare today's price to prices from a
specified prior time period. The name of the index specifies the
time period (e.g., 92-96 index = compare today's price to prices
from 96, 95, 94, 93, and 92 trading days earlier). Although I
use the oldest gold mutual fund, USERX, for analyses, the predictions
are applicable to the broad precious metals' market. I do not
recommend or analyze specific stocks, but my subscribers from
around the world regularly discuss individual issues on our Forum.
In addition to the truly unique SKI indices, I also use "run
patterns" to guesstimate turning points in the precious metals'
market. A "run" refers to a pattern of daily up and
down market closing prices. If the market has 3 consecutive days
of higher closing prices, the run is "3 up". If prices
then decline for 2 consecutive days, the run becomes "3 up
and 2 down". If prices then close higher the next day, the
run changes to "2 down and 1 up". Some people have referred
to run patterns as "worms". A run pattern is only completed
after the direction of closing prices has changed. I have compiled
a listing of every run pattern that has ever occurred and generated
probabilities that the end of the run marks a high or a low, moderated
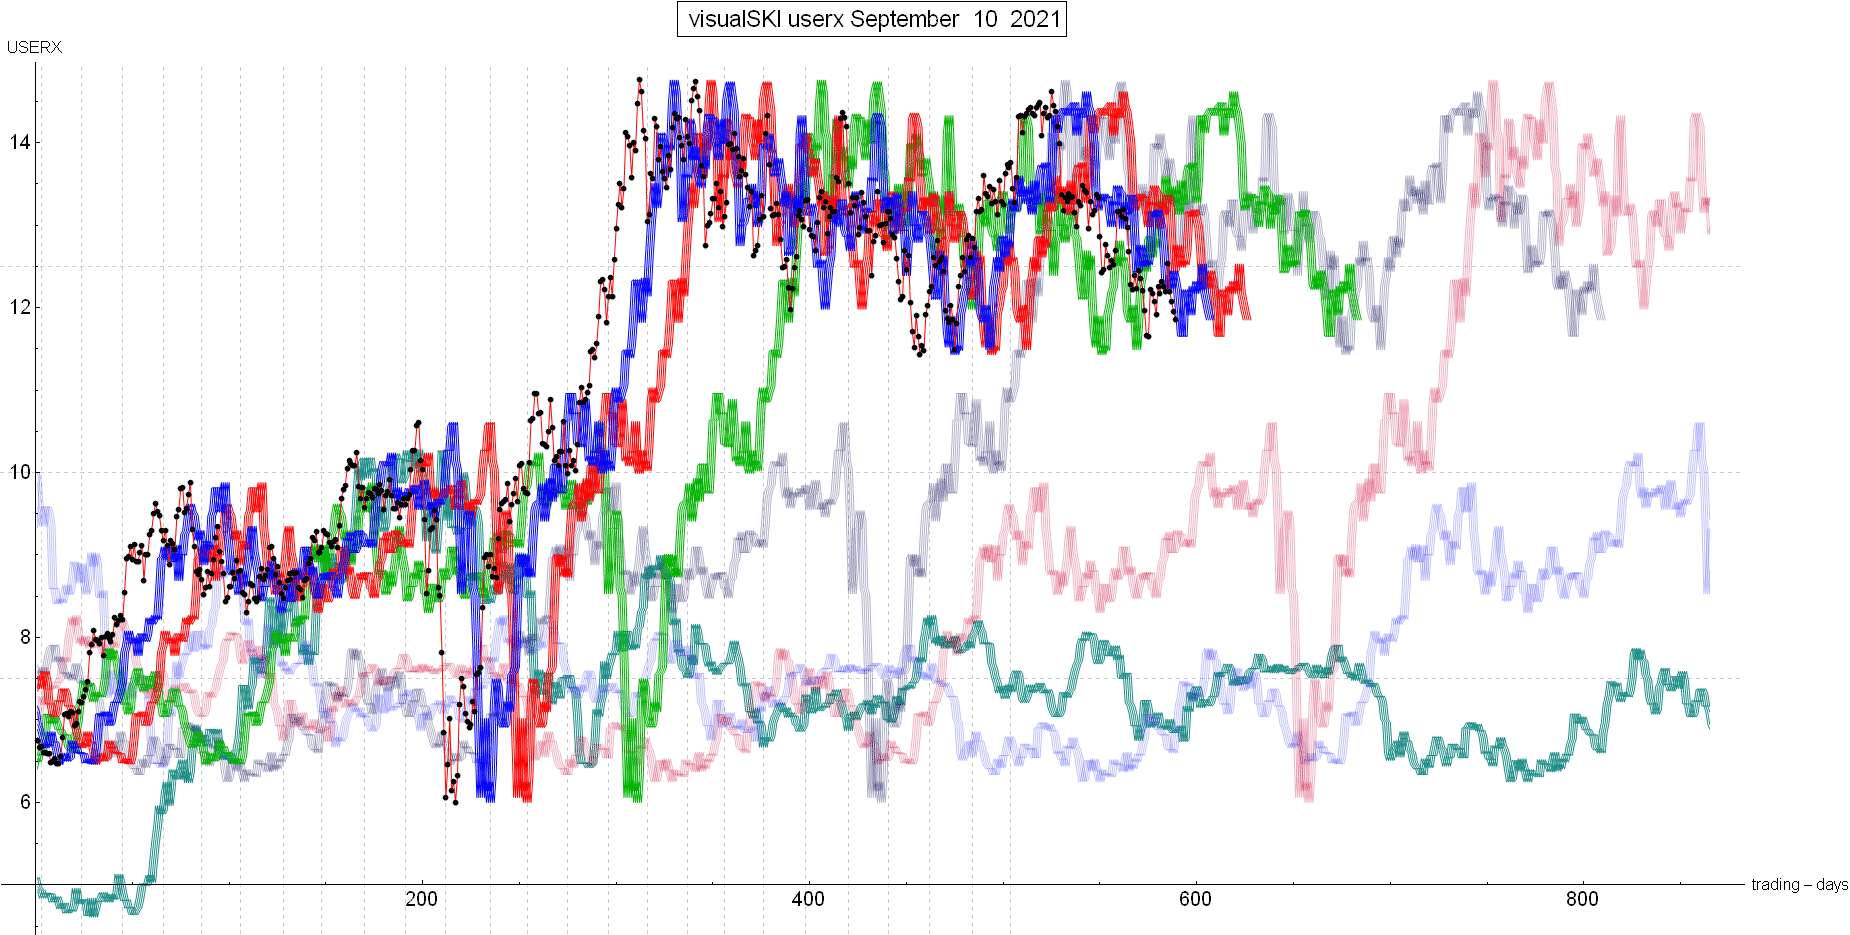
by the indices themselves. New Material The last SKI Report, written on 8/22/21, described how USERX had again been unable to rise above the lowest index resistance (the 16-20 index) on 8/13/21 and then had declined for 5 consecutive days into a master 92-96 index sell signal on 8/19/21-8/20/21 at USERX 11.66. Jeff had sold a partial long position on 8/17/21 at 12.22 because it was apparent that the index was going to sell and prices almost always decline into such sell signals. That was the final objective sell-stop. The Report concluded that such index “sell” signals can absolutely mark lows and that a short-term rise was due, but that the 5-day run down wasn’t strong enough to fit with a “capitulation” low. “Discipline” is the key to long-term survival and prosperity. The expected short-term rise began the following day (8/23/21) via a solid 5% rise right back to USERX 12.22. With USERX below the 92-96 index, the 35-39 index, and the 16-20 index, the indices can only get “activated” if USERX rises to above at least one (or two) of those indices. SKI cannot provide an index buy signal without some rise. After USERX went below the 92-96 index for the sell-stop, the lowest index became (and will continue to be) the 16-20 index. Therefore, USERX MUST rise to above the prices from 16-20 trading days earlier to generate a 16-20 index first resistance sell signal. That WILL (100%) eventually occur, but when? During the past 2.5 months, USERX has risen to the 16-20 and/or 35-39 indices THREE times (on 7/14/21, 8/03/21, and 8/13/21). Each of those instances marked a high. Each time, USERX would rise so very close to getting over the index and then fail (i.e., the gold stocks were rejected by that resistance). The recent short-term rise into 9/03/21 came within 1 trading day of going above the 16-20 index’s back prices and hitting/touching the 35-39 index. USERX rose to 12.53 on 9/03/21’s weak U.S. Employment Report. If USERX closed above 12.44 on the next trading day (last Tuesday; 9/07/21), the 16-20 index would finally generate its “needed” signal and be “activated”. And if USERX could close above 12.41 on that same day, the 35-39 index would begin to be overcome. When the gold stocks declined solidly last Tuesday (9/07/21), they avoided “activating” the indices for the 4th time since the end of June. The bearish behavioral pattern had continued and the gold stocks dropped each day to stay below the DECLINING 16-20 index. If you’re getting more SKI-experienced, look at the current SKI chart to see what was described in the prior paragraph. The black dots are the USERX price, the blue line is the 16-20 index, the red line is the 35-39 index, and the green line is the 92-96 index. Can you see how USERX rose to almost get over the blue line and almost reach the red line on the rise 5 trading days (black dots) ago? And then just declined to stay below the DECLINING blue line? In the short-term, the 16-20 index’s five back prices decline on Monday (9/13/21) to include the 11.66 price from the prior low on 8/19/21. And on Tuesday (9/14/21), the index’s back prices add in the 11.65 price from 8/20/21. Remember, that’s where the 92-96 index’s sell signal marked a low. Will the gold stocks (USERX, HUI, GDX, GDXJ, etc.) now drop to below that low? The Australian XGD and the Australian Dollar should be monitored because USERX has 12% of its assets in Australia. The XGD.ax has just declined to below that low. If the bearish behavioral pattern is going to continue, USERX is likely to decline to below 11.66-11.65 during the early part of this coming week. For the bullish case to have a chance here (breaking the bearish pattern), USERX would need a rise back to above USERX 12.22 by the end of this coming week. In addition to index signals, lows can be marked using USERX run patterns. The current run pattern is 1 (day) Up and 4 (days) Down. A run pattern low requires a strong and long run down. The ongoing run down has only averaged 1.35% down per day, so far. Let’s see how the run down ends via one daily rise. Best Wishes, Jeff If you are interested in following and learning more about the SKI indices, I'll write another Report in three weeks or you can shell out the big bucks for a SKI subscription. Weekly Updates are available by subscribing for a month (or longer if you're wise and cheap enough to want to save money) at my website www.skigoldstocks.com for the princely sum of $30 (for a one month subscription) or more ($240 for an annual subscription). I also provide more frequent intra-week daily messages/alerts at a slightly higher price along with access to our informative Forum. ###  SKI archives SKI archives
email: jeff@skigoldstocks.com
Jeffrey M. Kern,Ph.D., is an academic psychologist with a specialty in the measurement and prediction of human behavior. The communications provided are for informational purposes only and are not intended to be investment advice or recommendations for specific investment decisions. Dr. Kern is not a registered investment advisor, but is registered as a commodity trading advisor (CTA). The information provided is considered accurate, but cannot be guaranteed. Investments/trading in narrow market segments or gold futures is for individuals willing to accept a higher level of risk for the opportunity of greater returns. Past performance is no guarantee of future performance. His website is www.skigoldstocks.com.
Communications should be sent to: jeff@skigoldstocks.com.
Copyright © 2002-2024 Jeffrey Kern. All Rights Reserved.
321gold Ltd

| 