 Special SKI Report #258 Special SKI Report #258
Gold Stock Update: The master 92-96 index sold Jeffrey M. Kern, Ph.D.
Email: jeff@skigoldstocks.com
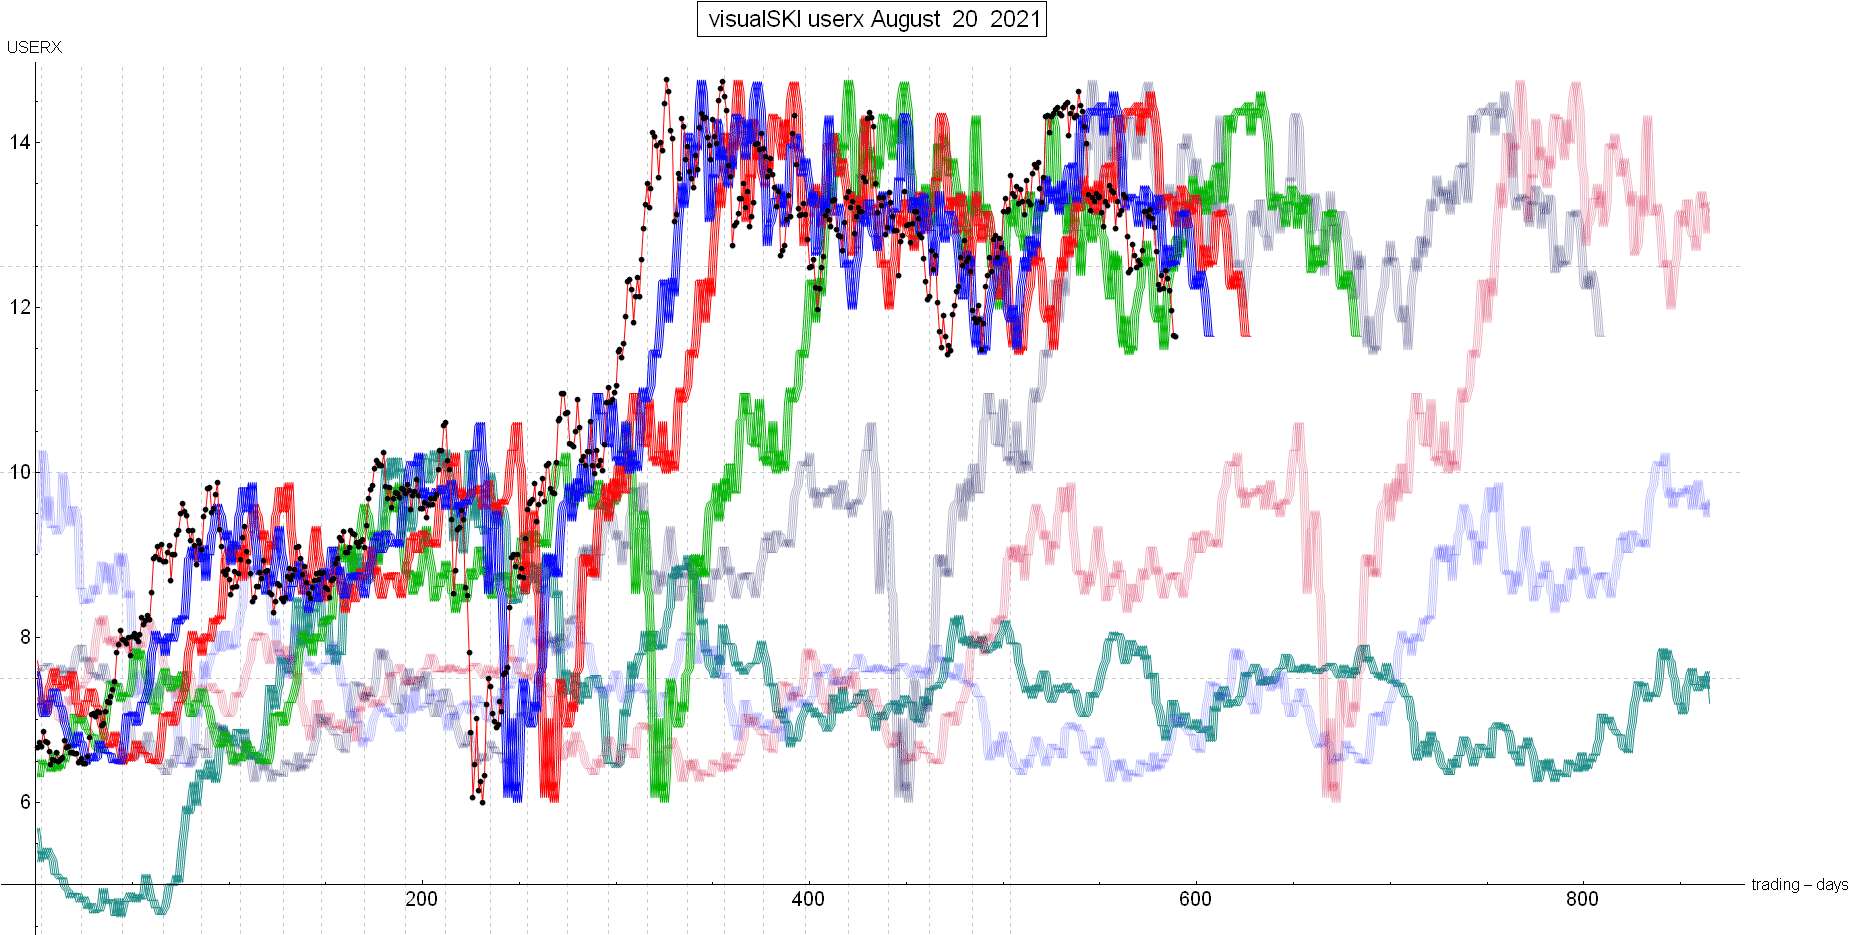
USERX | historicals
Written Sunday Aug 22, 2021
Published Aug 23, 2021 Current USERX price = 11.65, Down a large $1.51 (11.5%) since the last report 3 weeks ago. Introduction (repeated from prior Reports):
I have been using my unique SKI indices
to predict price changes in the precious metals' market for more
than two decades. And my indices continue to mark the critical
points. I have initiated a subscription website since 1/13/06
(yes, Friday the 13th) after having posted free updates for years
at www.321gold.com. SKI is a timing service; although
almost everyone seems to believe that market timing is impossible,
that IS what the SKI indices have done for 36 years.
The SKI indices contain short-term (16-20
trading days), intermediate-term (35-39 trading days), and long-term
(92-96 trading days) indices. A more comprehensive description
of these mathematical indices and their history is found here.
Basically, the indices compare today's price to prices from a
specified prior time period. The name of the index specifies the
time period (e.g., 92-96 index = compare today's price to prices
from 96, 95, 94, 93, and 92 trading days earlier). Although I
use the oldest gold mutual fund, USERX, for analyses, the predictions
are applicable to the broad precious metals' market. I do not
recommend or analyze specific stocks, but my subscribers from
around the world regularly discuss individual issues on our Forum.
In addition to the truly unique SKI indices, I also use "run
patterns" to guesstimate turning points in the precious metals'
market. A "run" refers to a pattern of daily up and
down market closing prices. If the market has 3 consecutive days
of higher closing prices, the run is "3 up". If prices
then decline for 2 consecutive days, the run becomes "3 up
and 2 down". If prices then close higher the next day, the
run changes to "2 down and 1 up". Some people have referred
to run patterns as "worms". A run pattern is only completed
after the direction of closing prices has changed. I have compiled
a listing of every run pattern that has ever occurred and generated
probabilities that the end of the run marks a high or a low, moderated
by the indices themselves. New Material The last SKI Report, written on 8/01/21, tried to provide a concise and clear concluding paragraph: “You should be able to see that USERX has now risen to hit/touch the first resistance blue 16-20 index line exactly as the green index line reached its mid-March 2021 temporary high. The sell-stop 92-96 index is now temporarily dropping. An ongoing bullish trend needs USERX to stay above the green index line. The historical time period for a corrective decline has not been used up, but “soon” (time reserved) USERX needs to get above the DECLINING blue (16-20), red (35-39), AND faded purple (very long-term 218-222 trading day) index lines.” You needed to spend time looking at the SKI chart's index lines. I appreciate that your time is limited and that you can be inundated with questionable predictive reports. Yet, like every other “predictor/analyst”, Jeff believes that the likelihood of executing with discipline will increase IF some time is used to “understand” the indices and the historical SKI (nature) index patterns and run patterns. So click the link for that SKI chart from 3 weeks ago. The black dots are the USERX price, the green line is the 92-96 index. USERX was hitting/touching the blue index first resistance line. For the bullish case, the black dots needed to go above those index lines. A decline needed the black dots (USERX) to stay above the green line 92-96 index. With the benefit of hindsight, the important technical day was in 3 trading days, on Wednesday 8/04/21. The gold stocks gapped higher and a positive close would finally take USERX bullishly above the blue index lines. But the gold stocks lost those early gains to close lower. The ensuing decline went down to exactly hit/touch the green index line at USERX 12.22-12.23 on 8/12/21. Hits/touches of that index have marked lows since 4/12/21 and USERX “needed” (for the bullish case) to remain above that index. The gold stocks did rise to USERX 12.45 on Friday 8/13/21, but that only hit/touched the resistance blue line again. The gold stocks, once again, could NOT get above that blue line 16-20 index. The SKI chart now shows how USERX declined during this past week to below the green line. Jeff “survives/prospers” over decades by using sell-stops. When USERX was declining on this past Tuesday (8/17/21) to below the green line, it was time to sell at USERX 12.21 (a new low by 1-penny) for a further decline, as per a rather rare SKI Intra-Week morning Update. Jeff sold at a 3% loss, adding to a 1% loss by trading to the long side since 6/18/21’s decline to a supportive 16-20 index buy signal. The loss reduced the 11% gain from buying in early April 2021 and selling on 5/17/21. The master index sell-stop was activated and the SKI indices are about to go into bearish alignment. That means that rises will meet index resistance (i.e., rises to the blue, red, and/or green index lines). In the short-term, USERX has declined for 5 consecutive trading days. The decline has actually only been mild-normal via a 1.3% average daily decline. Such declines usually end at 5 or 6 days down, so a short-term rise is due. In the intermediate-term, the 92-96 index sell signal executed (i.e., technically marked) this past Thursday (8/19/21) at USERX 11.66. The gold stocks DID decline into the actual index signal, as is “historically normal”. Be aware that such index signals mark technical spots and have marked some exact lows. The most recent examples are the COVID 3/13/2020 crash low (setting up the large 2020 SKI bull market gain) and a 12/20/2019 exact low. But again, discipline is a “key” and the current 5-day decline hasn’t been strong/large enough to fit with “a capitulation low” that likely awaits. Best Wishes, Jeff If you are interested in following and learning more about the SKI indices, I'll write another Report in three weeks or you can shell out the big bucks for a SKI subscription. Weekly Updates are available by subscribing for a month (or longer if you're wise and cheap enough to want to save money) at my website www.skigoldstocks.com for the princely sum of $30 (for a one month subscription) or more ($240 for an annual subscription). I also provide more frequent intra-week daily messages/alerts at a slightly higher price along with access to our informative Forum. ###  SKI archives SKI archives
email: jeff@skigoldstocks.com
Jeffrey M. Kern,Ph.D., is an academic psychologist with a specialty in the measurement and prediction of human behavior. The communications provided are for informational purposes only and are not intended to be investment advice or recommendations for specific investment decisions. Dr. Kern is not a registered investment advisor, but is registered as a commodity trading advisor (CTA). The information provided is considered accurate, but cannot be guaranteed. Investments/trading in narrow market segments or gold futures is for individuals willing to accept a higher level of risk for the opportunity of greater returns. Past performance is no guarantee of future performance. His website is www.skigoldstocks.com.
Communications should be sent to: jeff@skigoldstocks.com.
Copyright © 2002-2024 Jeffrey Kern. All Rights Reserved.
321gold Ltd

| 