 Special SKI Report #275 Special SKI Report #275
Gold Stock Update Jeffrey M. Kern, Ph.D.
Email: jeff@skigoldstocks.com
USERX | historicals
Written Sunday Aug 21, 2022
Published Aug 22, 2022 Current USERX price = 9.26, Down 38 cents (3.9%) since the last report 3 weeks ago. Introduction (repeated from prior Reports):
I have been using my unique SKI indices
to predict price changes in the precious metals' market for more
than two decades. And my indices continue to mark the critical
points. I have initiated a subscription website since 1/13/06
(yes, Friday the 13th) after having posted free updates for years
at www.321gold.com. SKI is a timing service; although
almost everyone seems to believe that market timing is impossible,
that IS what the SKI indices have done for 36 years.
The SKI indices contain short-term (16-20
trading days), intermediate-term (35-39 trading days), and long-term
(92-96 trading days) indices. A more comprehensive description
of these mathematical indices and their history is found here.
Basically, the indices compare today's price to prices from a
specified prior time period. The name of the index specifies the
time period (e.g., 92-96 index = compare today's price to prices
from 96, 95, 94, 93, and 92 trading days earlier). Although I
use the oldest gold mutual fund, USERX, for analyses, the predictions
are applicable to the broad precious metals' market. I do not
recommend or analyze specific stocks, but my subscribers from
around the world regularly discuss individual issues on our Forum.
In addition to the truly unique SKI indices, I also use "run
patterns" to guesstimate turning points in the precious metals'
market. A "run" refers to a pattern of daily up and
down market closing prices. If the market has 3 consecutive days
of higher closing prices, the run is "3 up". If prices
then decline for 2 consecutive days, the run becomes "3 up
and 2 down". If prices then close higher the next day, the
run changes to "2 down and 1 up". Some people have referred
to run patterns as "worms". A run pattern is only completed
after the direction of closing prices has changed. I have compiled
a listing of every run pattern that has ever occurred and generated
probabilities that the end of the run marks a high or a low, moderated
by the indices themselves. New Material
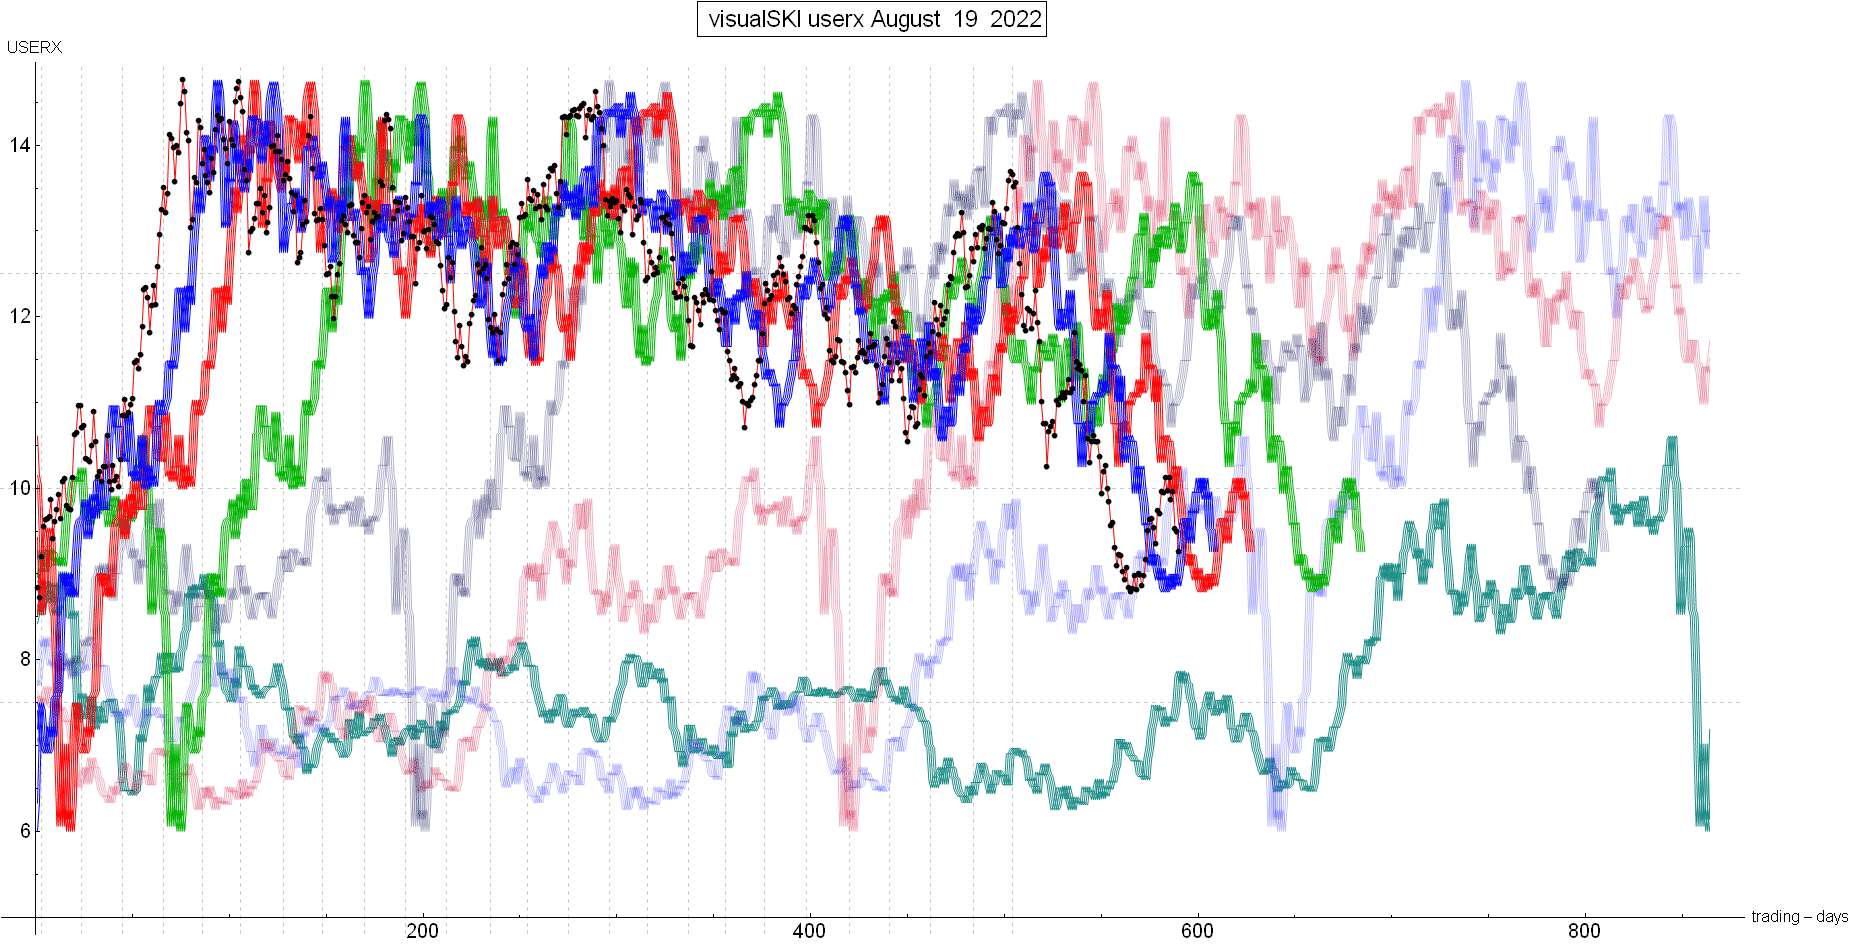
The last SKI Report, written on 7/31/22, described how the HUI and USERX had declined, as expected, into their 663 index buy signals (comparing the current price to the prices from 660-664 trading days earlier) on 7/15/22 and 7/25/22, respectively. The 663 index is contrarian, buying on declines and selling on rises. It appeared that the index buy signals had marked the exact low(s) as the gold stocks rose immediately after USERX’s buy signal. The rise had quickly gone back above the 663 index for a first resistance sell signal that was going to execute on Monday, 8/01/22, and was about to go above the 16-20 index for its first resistance sell signal. That last public Report concluded that if the rise was going to continue, the next upside target was USERX’s 35-39 index (comparing the current price to the prices from 35-39 trading days earlier). The last Report concluded with a description of USERX’s 2 Down and 4 Up: A further rise on Monday (8/01/22) would form an interesting/meaningful 2 Down and 5 Up run pattern. On Monday, although the HUI and GDX declined a fraction, USERX rose 1-penny to 9.65. Such run patterns mark lows AND/OR highs. Since the 2 days down had marked a low into the 663 index’s buy signal, there was some (although reduced) possibility of Monday having marked a high when the run higher stopped (usually at 5 to 6 days Up). Therefore, the recommendation for very short-term traders was to sell some on the first day down and then re-buy quickly on a further “solid” (2%) decline. Hence, traders were supposed to sell on Tuesday’s (8/02/22) decline and buy back the next day when USERX and the HUI dropped 2%. That worked out well as the gold stocks surged to a new high on Wednesday (8/03/22). The rise then continued, as expected, into 8/12/22 at USERX 10.12. As per the SKI chart, that rise persisted exactly into the 35-39 index. The black dots are the USERX price and the plunging red line is the 35-39 index. See here. Click the chart to enlarge it. It was supposed to be second resistance. The index was hit/touched on 8/12/22 at 10.12 and then again on 8/14/22 at USERX 9.96. This past week’s decline (after hitting USERX’s 35-39 index) demonstrated that the second resistance held. The above SKI chart shows how USERX’s decline has kept it from going above the red line, but USERX has now gone back below the faded blue line to generate a second 663 index buy signal. The decline has also begun to hit/touch the supportive and rising 16-20 index (the blue index line). The history of the indices since 1974 indicates that a second 663 index buy signal and a new 16-20 index buy signal may NOT hold here. If they do not hold as support, the gold stocks should do one additional 1-2 month (approximate) plunge into a final low. Alternatively, if a 16-20 index buy signal is followed by a brief rise above that plunging red 35-39 index line, the bullish case will renew with a rising sell-stop (the then rising red 35-39 index line). Be careful here… Best Wishes, Jeff If you are interested in following and learning more about the SKI indices, I'll write another Report in three weeks or you can shell out the big bucks for a SKI subscription. Weekly Updates are available by subscribing for a month (or longer if you're wise and cheap enough to want to save money) at my website www.skigoldstocks.com for the princely sum of $30 (for a one month subscription) or more ($240 for an annual subscription). I also provide more frequent intra-week daily messages/alerts at a slightly higher price along with access to our informative Forum. ###  SKI archives SKI archives
email: jeff@skigoldstocks.com
Jeffrey M. Kern,Ph.D., is an academic psychologist with a specialty in the measurement and prediction of human behavior. The communications provided are for informational purposes only and are not intended to be investment advice or recommendations for specific investment decisions. Dr. Kern is not a registered investment advisor, but is registered as a commodity trading advisor (CTA). The information provided is considered accurate, but cannot be guaranteed. Investments/trading in narrow market segments or gold futures is for individuals willing to accept a higher level of risk for the opportunity of greater returns. Past performance is no guarantee of future performance. His website is www.skigoldstocks.com.
Communications should be sent to: jeff@skigoldstocks.com.
Copyright © 2002-2024 Jeffrey Kern. All Rights Reserved.
321gold Ltd

|
