 Special SKI Report #274 Special SKI Report #274
Gold Stock Buy Completed Jeffrey M. Kern, Ph.D.
Email: jeff@skigoldstocks.com
USERX | historicals
Written Sunday Jul 31, 2022
Published Aug 1, 2022 Current USERX price = 9.64, Up 43 cents (4.7%) since the last report 3 weeks ago. Introduction (repeated from prior Reports):
I have been using my unique SKI indices
to predict price changes in the precious metals' market for more
than two decades. And my indices continue to mark the critical
points. I have initiated a subscription website since 1/13/06
(yes, Friday the 13th) after having posted free updates for years
at www.321gold.com. SKI is a timing service; although
almost everyone seems to believe that market timing is impossible,
that IS what the SKI indices have done for 36 years.
The SKI indices contain short-term (16-20
trading days), intermediate-term (35-39 trading days), and long-term
(92-96 trading days) indices. A more comprehensive description
of these mathematical indices and their history is found here.
Basically, the indices compare today's price to prices from a
specified prior time period. The name of the index specifies the
time period (e.g., 92-96 index = compare today's price to prices
from 96, 95, 94, 93, and 92 trading days earlier). Although I
use the oldest gold mutual fund, USERX, for analyses, the predictions
are applicable to the broad precious metals' market. I do not
recommend or analyze specific stocks, but my subscribers from
around the world regularly discuss individual issues on our Forum.
In addition to the truly unique SKI indices, I also use "run
patterns" to guesstimate turning points in the precious metals'
market. A "run" refers to a pattern of daily up and
down market closing prices. If the market has 3 consecutive days
of higher closing prices, the run is "3 up". If prices
then decline for 2 consecutive days, the run becomes "3 up
and 2 down". If prices then close higher the next day, the
run changes to "2 down and 1 up". Some people have referred
to run patterns as "worms". A run pattern is only completed
after the direction of closing prices has changed. I have compiled
a listing of every run pattern that has ever occurred and generated
probabilities that the end of the run marks a high or a low, moderated
by the indices themselves. New Material
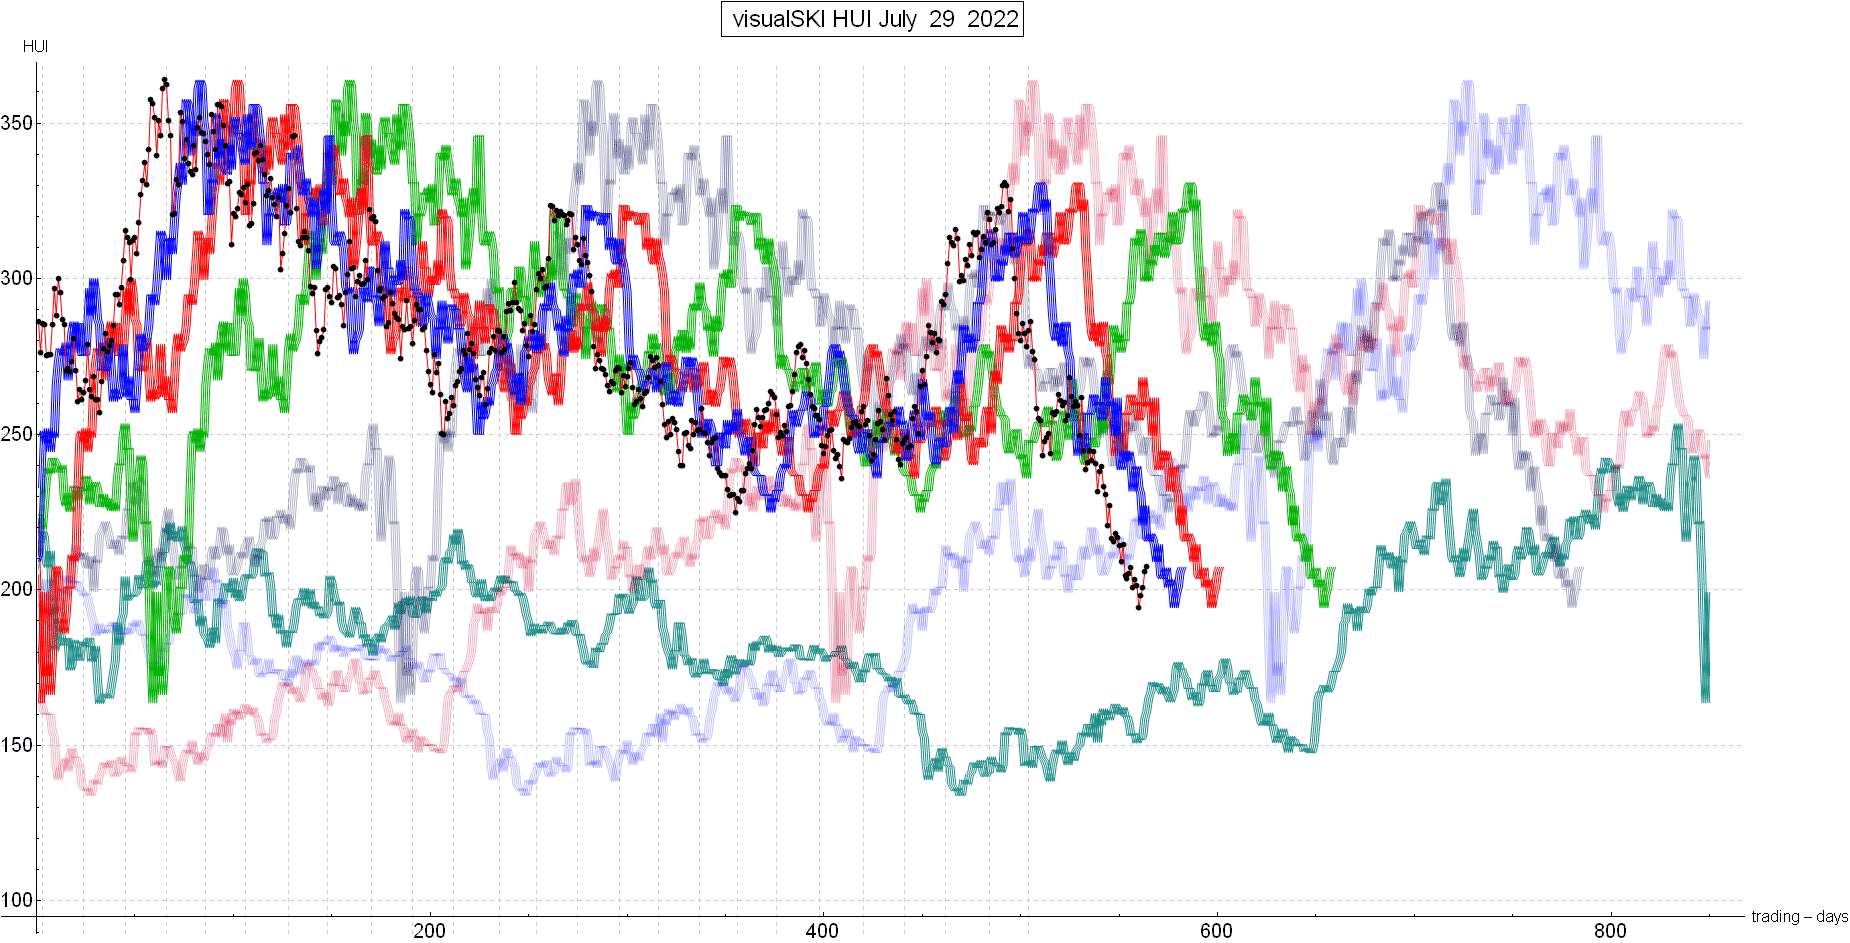
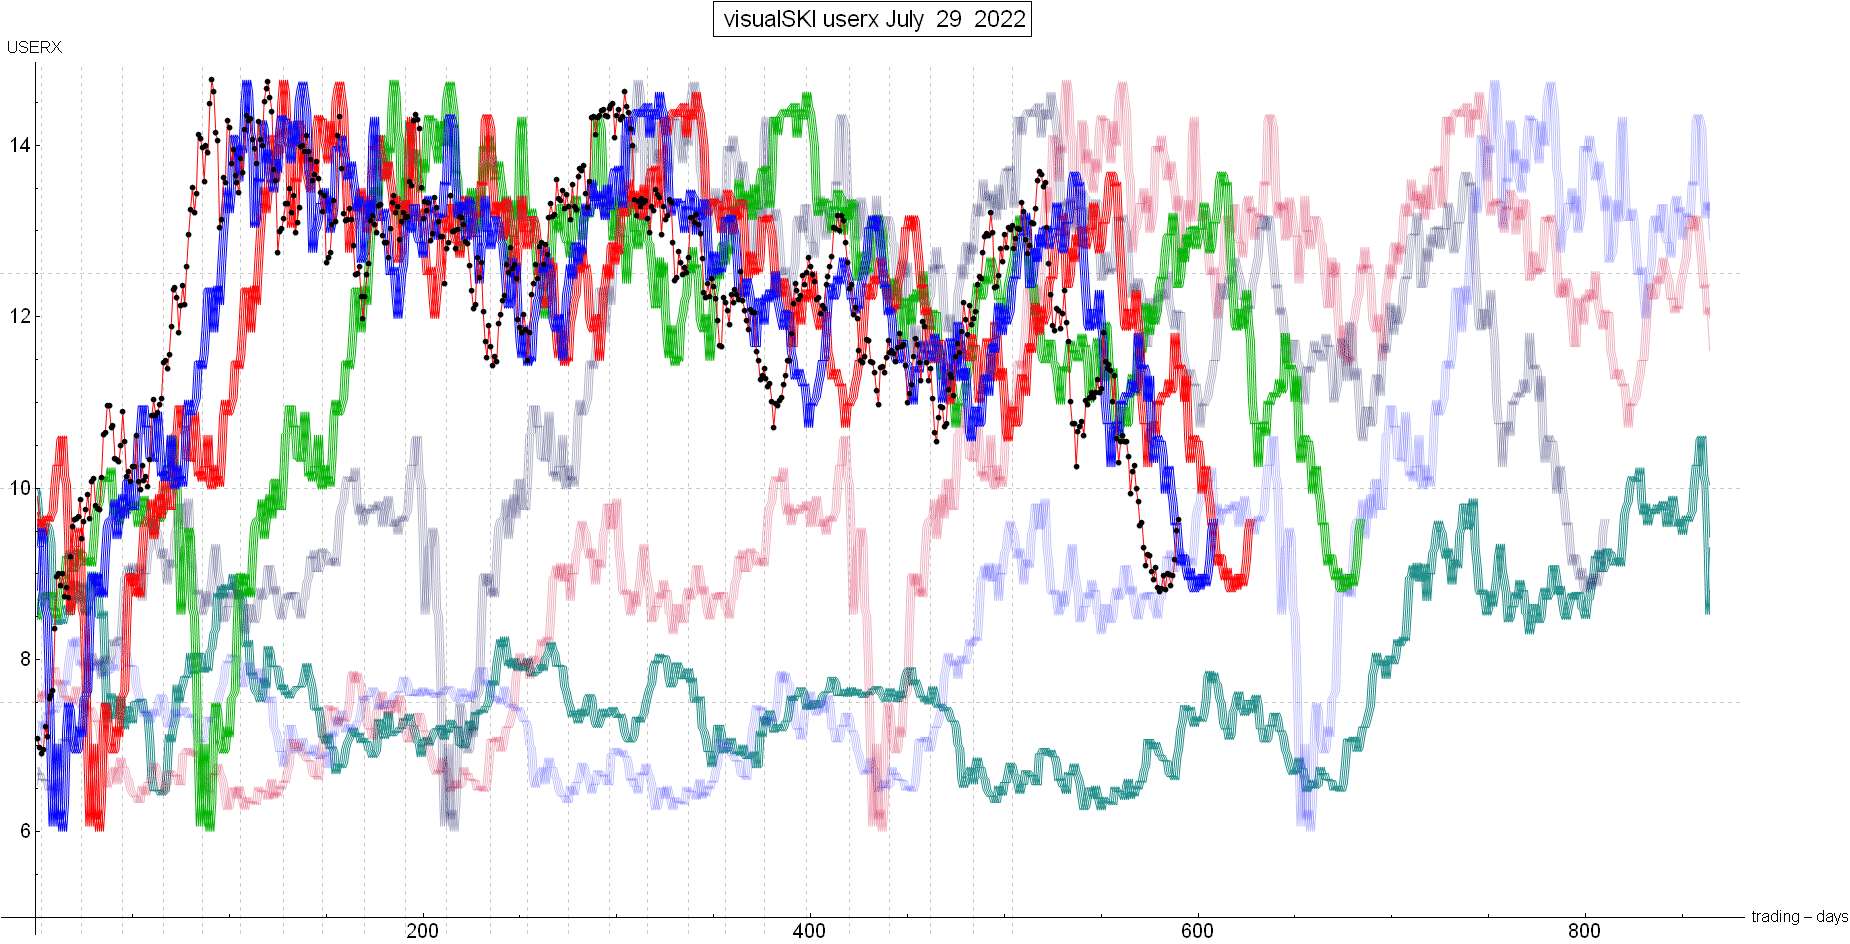
The last SKI Report, written on 7/10/22, concluded that a further decline was historically-expected. The decline from the prior 6/16/22’s XXed Out 16-20 index “buy” signal had not yet completed. The decline had to be expected to extend down to the next index: The long-term 663 index via an approximate further 7-8% drop. The 663 index buys on DECLINES by comparing the current price to prices from 660-664 trading days earlier. Readers were urged to join SKI on this decline. And so, the decline did persist into a HUI 663 index buy signal. The indices were researched in 1985 so as to provide a 1-day “advanced notice”. For example, the HUI’s 663 index buy signal generated on 7/14/22 and then executed on 7/15/22. We use the HUI for auxiliary information. The HUI isn’t as valid an index as USERX because USERX incorporates movements in the Australian, Canadian, U.S., and South African gold stocks PLUS the movement in the Canadian and Australian currencies relative to the U.S. Dollar. Those currency movements are VERY important. You can see how the HUI fell below its faded blue 663 index line: see here. I’d furthermore mention, as I have for decades, that GDX, GDXJ, the XAU, and the other indices that analysts follow contain similar limitations relative to USERX. USERX’s 663 index was within one day of generating its buy signal on 7/20/22 as gold dropped below $1700, fell to $1680 during overnight trading, and then solidly rebounded higher. When the gold stocks rose on 7/21/22 into the morning of 7/22/22, Jeff was concerned that the 663 index’s buy would be avoided and that we’d miss buying the low. But patience and discipline paid off: The gold stocks ended up declining on 7/22/22 and generated the 663 index’s buy signal for execution on the next trading day (7/25/22). Although I show the pictorial representation of the SKI indices in these public SKI reports, the indices are computed using a simple mathematical formula provided to subscribers. The formula compares the current daily prices to the indices’ historical prices for each day, and IMPORTANTLY, incorporates the velocity and acceleration of prices changes. When Newmont Mining (NEM) reported supposedly “poor earnings” on 7/25/22, it and other large-capitalization gold stocks really declined. The HUI, GDX, and other widely-used indices are capitalization-weighted measures. Therefore, they are “over-weighted” towards Newmont Mining, Barrick Gold, etc.. The decline was very nice as the 663 index is supposed to buy on a decline and mark a low (with a mean of 0 days and a standard deviation of 1 trading days). Buy signals officially execute at the close of a trading day. And so, we bought the close on 7/25/22. USERX closed at 8.86. The ensuing 4-day rise of 9% strongly suggests that USERX’s 663 index buy signal marked the exact low for the Canadian gold stocks (XGD.to), GDX, the HUI, and the large-capitalization gold stocks. Interestingly, it’s turned out that the HUI’s 663 index buy signal on 7/15/22 marked the exact low for the Australian gold stocks (XGD.ax), GDXJ, and even USERX at 8.79. Now, the SKI chart shows how USERX has risen back above the faded blue 663 index line. It’s also very close to going above the blue 16-20 index line. The black dots are the USERX price: see here. Therefore, the mathematics are in the process of providing a first resistance 663 index sell signal and a first resistance 16-20 index sell. Again, both of these indices “are contrarian” and sell on rises. If the rise continues, the next USERX upside target is the plunging red line (the 35-39 index that uses the prices from 35-39 trading days ago). Monday (8/01/22) and Tuesday (8/02/22) are going to be meaningful interesting days. The USERX run pattern is at 2 days Down (into the 7/25/22 low) and 4 days Up. The Canadian market is closed on Monday. That will greatly reduce USERX’s movement. Any USERX rise on Monday will form an historically-meaningful 2 Down and 5 Up run pattern averaging about 2% up per day. Such rather rare run patterns mark lows on the 2 Down, but can also mark highs when the run higher stops via a down day. The run higher usually stops at 5 or 6 consecutive daily rises. Combined with the first resistance sell signals, at least a brief decline would then be expected. But the 663 index’s buy signal worked again, as it did at the March 2020 COVID-crash low (i.e., the prior 663 index buy signal). Best Wishes, Jeff If you are interested in following and learning more about the SKI indices, I'll write another Report in three weeks or you can shell out the big bucks for a SKI subscription. Weekly Updates are available by subscribing for a month (or longer if you're wise and cheap enough to want to save money) at my website www.skigoldstocks.com for the princely sum of $30 (for a one month subscription) or more ($240 for an annual subscription). I also provide more frequent intra-week daily messages/alerts at a slightly higher price along with access to our informative Forum. ###  SKI archives SKI archives
email: jeff@skigoldstocks.com
Jeffrey M. Kern,Ph.D., is an academic psychologist with a specialty in the measurement and prediction of human behavior. The communications provided are for informational purposes only and are not intended to be investment advice or recommendations for specific investment decisions. Dr. Kern is not a registered investment advisor, but is registered as a commodity trading advisor (CTA). The information provided is considered accurate, but cannot be guaranteed. Investments/trading in narrow market segments or gold futures is for individuals willing to accept a higher level of risk for the opportunity of greater returns. Past performance is no guarantee of future performance. His website is www.skigoldstocks.com.
Communications should be sent to: jeff@skigoldstocks.com.
Copyright © 2002-2024 Jeffrey Kern. All Rights Reserved.
321gold Ltd

|
