 Special SKI Report #237 Special SKI Report #237
Gold Stock Timing Update Jeffrey M. Kern, Ph.D.
Email: jeff@skigoldstocks.com
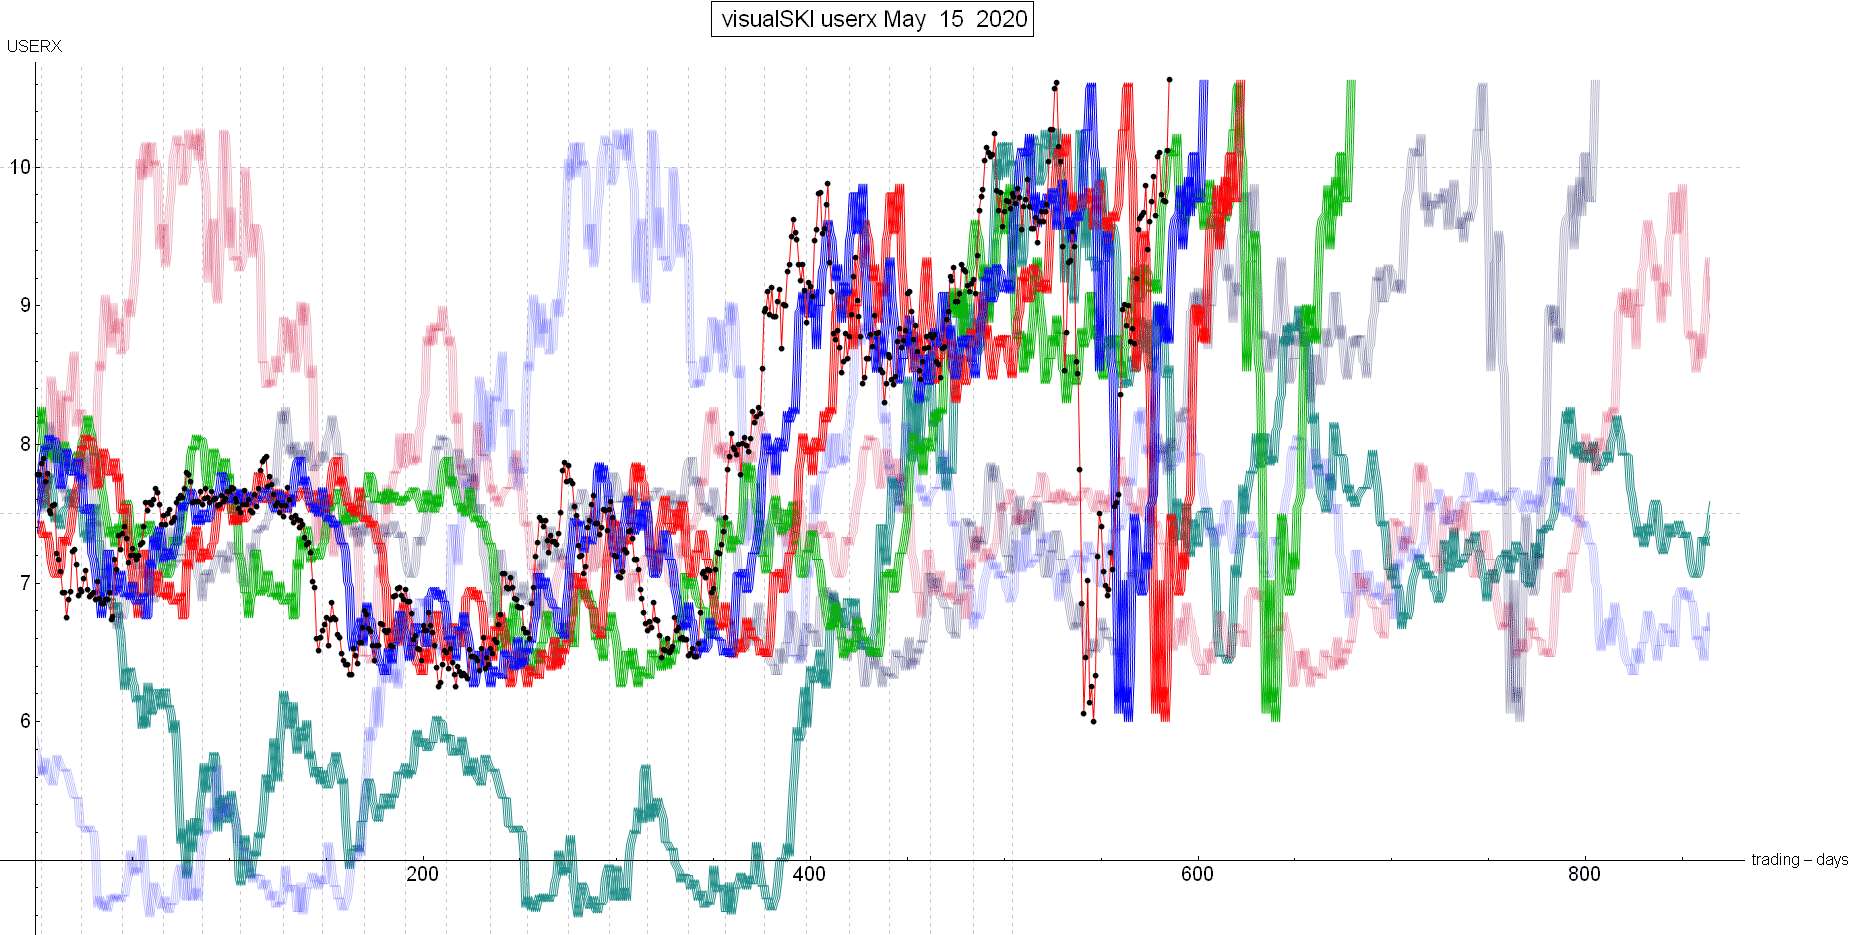
USERX | historicals
Written Sunday May 31, 2020
Published Jun 1, 2020 Current USERX price = 10.50, Up another $0.39 (3.9%) since the last report 3 weeks ago. Introduction (repeated from prior Reports):
I have been using my unique SKI indices
to predict price changes in the precious metals' market for more
than two decades. And my indices continue to mark the critical
points. I have initiated a subscription website since 1/13/06
(yes, Friday the 13th) after having posted free updates for years
at www.321gold.com. SKI is a timing service; although
almost everyone seems to believe that market timing is impossible,
that IS what the SKI indices have done for 36 years.
The SKI indices contain short-term (16-20
trading days), intermediate-term (35-39 trading days), and long-term
(92-96 trading days) indices. A more comprehensive description
of these mathematical indices and their history is found here.
Basically, the indices compare today's price to prices from a
specified prior time period. The name of the index specifies the
time period (e.g., 92-96 index = compare today's price to prices
from 96, 95, 94, 93, and 92 trading days earlier). Although I
use the oldest gold mutual fund, USERX, for analyses, the predictions
are applicable to the broad precious metals' market. I do not
recommend or analyze specific stocks, but my subscribers from
around the world regularly discuss individual issues on our Forum.
In addition to the truly unique SKI indices, I also use "run
patterns" to guesstimate turning points in the precious metals'
market. A "run" refers to a pattern of daily up and
down market closing prices. If the market has 3 consecutive days
of higher closing prices, the run is "3 up". If prices
then decline for 2 consecutive days, the run becomes "3 up
and 2 down". If prices then close higher the next day, the
run changes to "2 down and 1 up". Some people have referred
to run patterns as "worms". A run pattern is only completed
after the direction of closing prices has changed. I have compiled
a listing of every run pattern that has ever occurred and generated
probabilities that the end of the run marks a high or a low, moderated
by the indices themselves. New Material The last SKI Report, written on Sunday, 5/10/20, reported that the post-crash SKI bull market in the gold stocks had maintained as USERX had remained above the master 92-96 index. This was visually displayed via the SKI index chart whereby the black dots (the USERX price) had remained above the green line (the 92-96 index that compares the current price to the prices from 92, 93, 94, 95, and 96 trading days earlier). But the key emphasis of that Update was to be alert because the index’s back prices were rising and USERX needed to remain above that green index line. What happened? Here’s the SKI index chart for the next week. Can you see how USERX went right down within a hair of going below the green line, but held? Here’s the daily review for that next weekend’s SKI Update: “On Monday (5/11/20), the surprisingly large decline to USERX 9.80 began to move the 92-96 index towards a sell signal as a 9.86 entered the index’s back prices. The SKI-math showed Jeff that it was time to sell IF USERX dropped to close below 9.69, even though the index could not generate a sell signal for another 2 trading days. On Tuesday (5/12/20), the gold stocks rose 1.5% in the morning, but kept fading as the general stock market tanked again. When USERX closed at 9.76, the index would generate a sell signal in 2 trading days if USERX closed below 9.84 tomorrow AND the next day. And a close below 9.69 tomorrow would require an UNlikely rise to over 10.04 the next day to avoid generating the sell signal. Therefore, Jeff was going to sell and send an emergency morning Sell Update tomorrow if USERX was highly likely to close below that 9.69. On Wednesday (5/13/20), the gold stocks again rose in the morning and then began to decline as the stock market declined again. During the day, USERX was estimated at below 9.69, and sat around 9.70 into the final hour. It was clear that the 92-96 index “knew” that exact important technical price of 9.69. The gold stocks recovered a little at the end of the day to close at 9.75. USERX needed to rise to over 9.84 tomorrow to avoid the index’s sell signal and it really needed a much stronger rise or else it would need to rise above 10.11 on Friday to avoid the sell signal (that 10.11 price also “just happened to be” the prior week’s 1 Down and 2 Up worrisome run pattern high). Jeff was prepared to send an emergency sell email if the gold stocks were declining tomorrow. And then on Thursday (5/14/20), the Australian (and other countries’) gold stocks had already risen overnight and USERX was edging higher. The rise was gaining strength and surged in the last few minutes to close at 10.12! History caused Jeff to write that USERX would not decline 3 cents tomorrow to sell the 92-96 index and that SKI/Jeff should be temporarily “done”. Jeff was proud of the index for validly marking the exact technical spot. Friday (5/15/20) yielded a further powerful rise to a new multi-year high at 10.63 (just above the 2/24/20 target high of 10.61)! Do you believe that markets are “random” (smile)?”. The following week (from 5/18/20-5/23/20) demonstrated for the hundredth+ time that even if you don’t subscribe to SKI, THE dependent measure to track is USERX because it includes the performance of Canadian, U.S., Australian, South African (and other countries’) gold/silver stocks AND the movements in those countries’ currencies. The U.S. Dollar index is not as important (because it is Euro and Yen weighted) as the above countries’ currencies relative to the U.S. Dollar. For example, if the Canadian Dollar and/or the Australian Dollar rise relative to the U.S. Dollar, that provides some support for USERX. As quoted from the 5/23/20 weekend SKI Update: “On Monday (5/18/20), the HUI gapped higher to fill the noted weekly down-gap at 300 from April 2013 and then reversed solidly lower. But USERX was higher throughout the day due to a powerful rise in the Aussie gold stocks, a large rise in the Aussie Dollar, the Canadian Dollar and other foreign currencies, and the holiday closure in Canada. The Canadian closure prevented those gold stocks from declining (timed perfectly by nature?) and USERX rose 2-cents to 10.65. Today highlighted (again) the “special” behavior of USERX. The USERX run pattern was now 3 Down and 3 Up. Such run patterns usually go to 4, 5, or 6 days up. On Tuesday (5/19/20), the gold stocks simply surged higher. USERX rose to a new 6+ year high at 10.96, although the HUI only closed right at the April 2013 down-gap level of 300. The USERX run pattern was now at 3 Down and 4 days Up. On Wednesday (5/20/20), the gold stocks rose in the morning and then reversed lower, but USERX was higher for most of the day due to a rise in Aussie gold stocks and a solid rise in the important foreign currencies (the Australian and Canadian Dollars). USERX closed unchanged at 10.96. The USERX run pattern was now at 3 Down and 5 Up because an unchanged day is counted as being in the same direction as the prior day (up).” NOW, when USERX declined on Thursday (5/21/20), it completed a 3 Down and 5+ Up run pattern (unlike any other dependent measure). That completed an 80+% probability "TOP of some type" on USERX's first down day. Therefore, traders were allowed to do disciplined-selling. It was also a worrisome 92-96 trading days from the early January 2020 high. Although further details were provided to SKIers, the basic information is that this run pattern has marked a high in 18 of the prior 22 occurrences since 1974 (including 6 declines that were intermediate-term declines lasting more than 1 month). Note that this is not 100% (!) and we remain above the 92-96 index in a potential bull market. Furthermore, the larger HUI decline since the run pattern top has been sufficient to generate a short-term supportive 16-20 index buy signal on last Thursday (5/28/20). During the past 13 years, the HUI has been the second-best dependent measure. Hoping that the above has been helpful, Best Wishes, Jeff If you are interested in following and learning more about the SKI indices, I'll write another Report in three weeks or you can shell out the big bucks for a SKI subscription. Weekly Updates are available by subscribing for a month (or longer if you're wise and cheap enough to want to save money) at my website www.skigoldstocks.com for the princely sum of $30 (for a one month subscription) or more ($240 for an annual subscription). I also provide more frequent intra-week daily messages/alerts at a slightly higher price along with access to our informative Forum. ###  SKI archives SKI archives
email: jeff@skigoldstocks.com
Jeffrey M. Kern,Ph.D., is an academic psychologist with a specialty in the measurement and prediction of human behavior. The communications provided are for informational purposes only and are not intended to be investment advice or recommendations for specific investment decisions. Dr. Kern is not a registered investment advisor, but is registered as a commodity trading advisor (CTA). The information provided is considered accurate, but cannot be guaranteed. Investments/trading in narrow market segments or gold futures is for individuals willing to accept a higher level of risk for the opportunity of greater returns. Past performance is no guarantee of future performance. His website is www.skigoldstocks.com.
Communications should be sent to: jeff@skigoldstocks.com.
Copyright © 2002-2024 Jeffrey Kern. All Rights Reserved. 321gold Ltd

| 