 Special SKI Report #236 Special SKI Report #236
Gold Stock Update: Be Alert Jeffrey M. Kern, Ph.D.
Email: jeff@skigoldstocks.com
USERX | historicals
Written Sunday May 10, 2020
Published May 11, 2020 Current USERX price = 10.11, Up another $1.37 (15.7%) since the last report 3 weeks ago. Introduction (repeated from prior Reports):
I have been using my unique SKI indices
to predict price changes in the precious metals' market for more
than two decades. And my indices continue to mark the critical
points. I have initiated a subscription website since 1/13/06
(yes, Friday the 13th) after having posted free updates for years
at www.321gold.com. SKI is a timing service; although
almost everyone seems to believe that market timing is impossible,
that IS what the SKI indices have done for 36 years.
The SKI indices contain short-term (16-20
trading days), intermediate-term (35-39 trading days), and long-term
(92-96 trading days) indices. A more comprehensive description
of these mathematical indices and their history is found here.
Basically, the indices compare today's price to prices from a
specified prior time period. The name of the index specifies the
time period (e.g., 92-96 index = compare today's price to prices
from 96, 95, 94, 93, and 92 trading days earlier). Although I
use the oldest gold mutual fund, USERX, for analyses, the predictions
are applicable to the broad precious metals' market. I do not
recommend or analyze specific stocks, but my subscribers from
around the world regularly discuss individual issues on our Forum.
In addition to the truly unique SKI indices, I also use "run
patterns" to guesstimate turning points in the precious metals'
market. A "run" refers to a pattern of daily up and
down market closing prices. If the market has 3 consecutive days
of higher closing prices, the run is "3 up". If prices
then decline for 2 consecutive days, the run becomes "3 up
and 2 down". If prices then close higher the next day, the
run changes to "2 down and 1 up". Some people have referred
to run patterns as "worms". A run pattern is only completed
after the direction of closing prices has changed. I have compiled
a listing of every run pattern that has ever occurred and generated
probabilities that the end of the run marks a high or a low, moderated
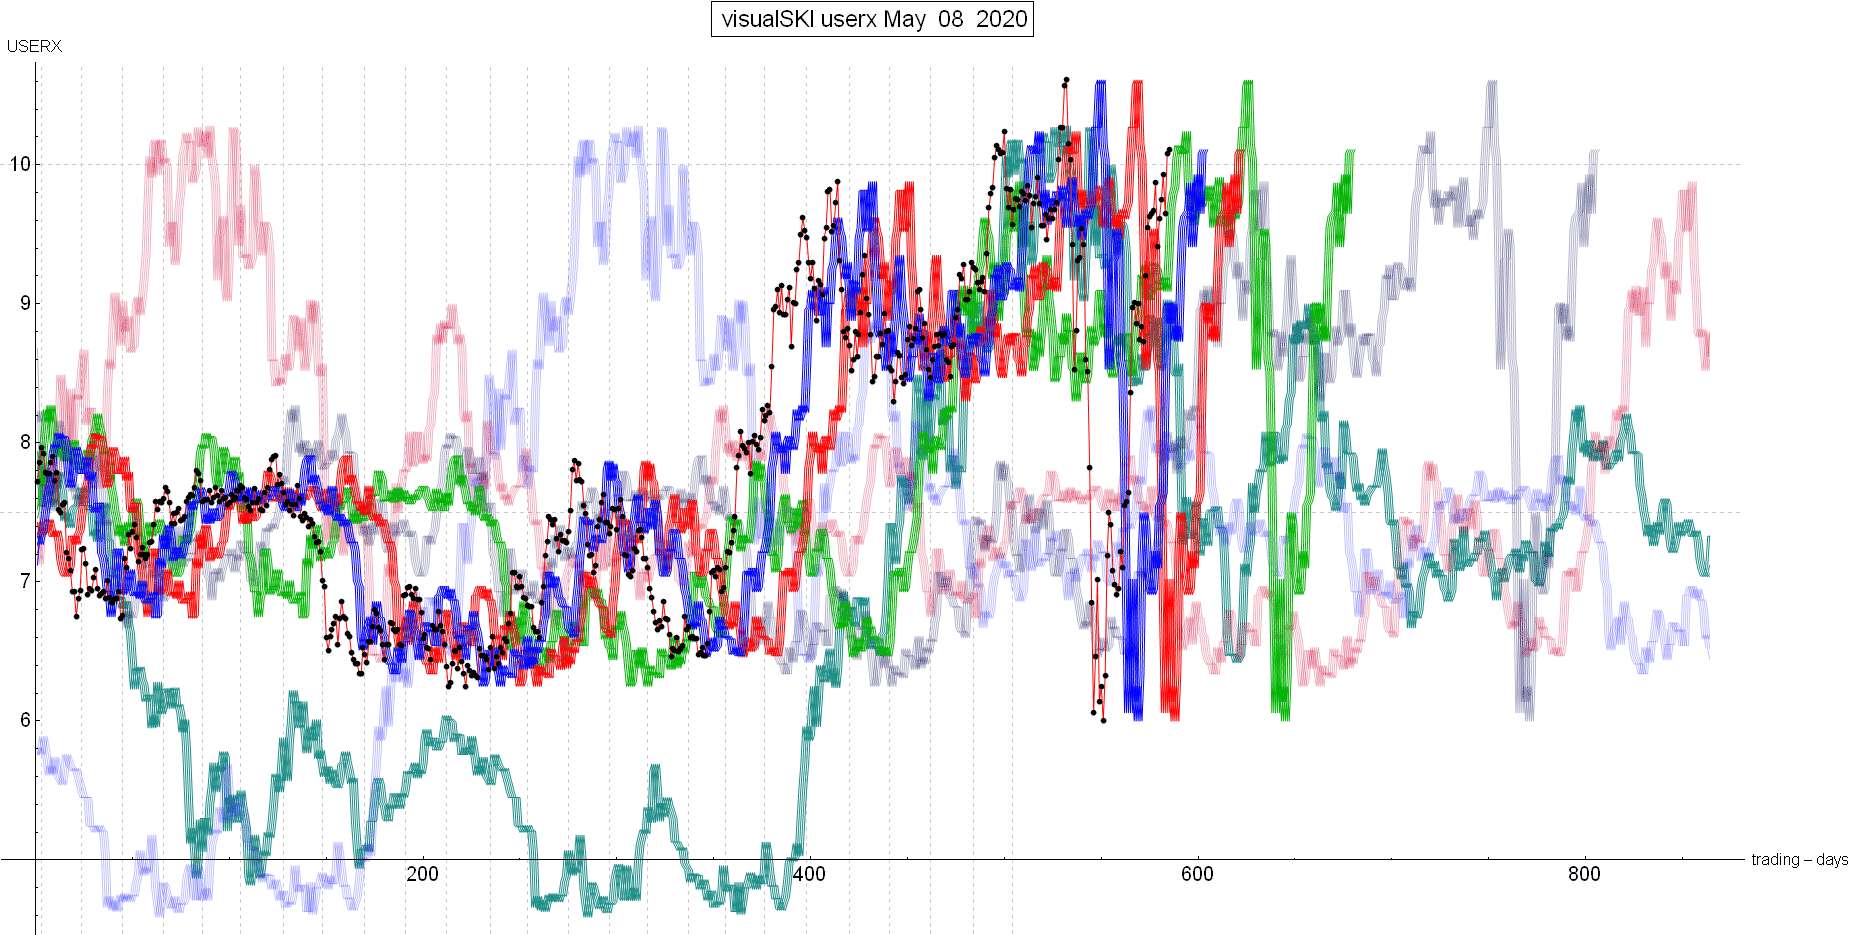
by the indices themselves. New Material The last SKI Report, written on Sunday, 4/19/20, contained two primary conclusions based upon the resistance master 92-96 index signal that executed at USERX 9.00 on 4/16/20. One conclusion was the all capitalized statement “HISTORICALLY, THIS 4/16/20 92-96 INDEX SIGNAL YIELDS A DECLINE TO A 92-96 INDEX SELL SIGNAL, AND USUALLY OCCURS “QUICKLY”. And then there was the boldfaced “Therefore, for the intermediate-term and longer-term bullish case, if the gold stocks do decline as expected in the short-term (this week), the resulting 884 index buy signal “had better be” marking the next low. And the 92-96 index will quickly sell to mark a technical spot, with a re-buy needed on a renewed rise”. I expect that few readers believe in the cycles, the indices, and the predictions that have flowed from the SKI indices over the decades. I understand. The world, the media, and especially the financial-related internet is filled with money-seeking scams. The formula for the SKI indices is provided, never changes, and cannot be faked. Jeff has always “given” that away. And so, the gold stocks rose a little on 4/20/20, but it wasn’t enough to stay above the 92-96 index’s back prices (USERX’s prices from 92-96 trading days earlier). The gold stocks then declined into the 4/21/20 execution of the 92-96 index’s “sell” signal. Jeff bought more at USERX 8.73 and bingo, an instant surge higher began. The 884 index never got involved. The surge WAS sufficient to quickly go back over the prices from 92-96 trading days earlier. And, as is common for the gold stocks, USERX simultaneously went above the 35-39 index (the prices from 35-39 trading days earlier). The index signals technically-marked the USERX 9.65 level on 4/27/20. Based upon the index history since 1974, the gold stocks were highly likely to yield at least a brief decline to below USERX 9.65. Yes, USERX rose for another 2 trading days to 9.87, but then dropped about 4% on 4/30/20 to USERX 9.41. Late buyers were SKI-allowed to buy or add. The ongoing case for the post-crash bull market needs to remain on that 92-96 index buy signal. Here’s a graph of the SKI indices. The master 92-96 is the green line. Do you see how USERX has kept rising to stay just above the green index line? The index is rising a little more during this coming week into the early January 2020 high and then it declines. If the index sells soon (95+% of the time on a decline), it would be historically-prudent to be “safe” and take some of these 40+% gains since the 221 index’s buy signal on 3/27/20. Jeff would then “bullishly hope” that it would get back over the green line, but I cannot predict the outcome until it occurs. I am, by nature, financially-conservative. I would rather miss some gains than take large losses. The only reason that I buy/sell the highly volatile gold stocks is because it is the only market that I can predict to a reasonable degree. And that’s due to the 1985 research discoveries that formed the SKI indices… Hoping that you and your family are well, Best Wishes, Jeff If you are interested in following and learning more about the SKI indices, I'll write another Report in three weeks or you can shell out the big bucks for a SKI subscription. Weekly Updates are available by subscribing for a month (or longer if you're wise and cheap enough to want to save money) at my website www.skigoldstocks.com for the princely sum of $30 (for a one month subscription) or more ($240 for an annual subscription). I also provide more frequent intra-week daily messages/alerts at a slightly higher price along with access to our informative Forum. ###  SKI archives SKI archives
email: jeff@skigoldstocks.com
Jeffrey M. Kern,Ph.D., is an academic psychologist with a specialty in the measurement and prediction of human behavior. The communications provided are for informational purposes only and are not intended to be investment advice or recommendations for specific investment decisions. Dr. Kern is not a registered investment advisor, but is registered as a commodity trading advisor (CTA). The information provided is considered accurate, but cannot be guaranteed. Investments/trading in narrow market segments or gold futures is for individuals willing to accept a higher level of risk for the opportunity of greater returns. Past performance is no guarantee of future performance. His website is www.skigoldstocks.com.
Communications should be sent to: jeff@skigoldstocks.com.
Copyright © 2002-2024 Jeffrey Kern. All Rights Reserved. 321gold Ltd

|
