 Special SKI Report #271 Special SKI Report #271
Life Run Low? Jeffrey M. Kern, Ph.D.
Email: jeff@skigoldstocks.com
USERX | historicals
Written Sunday May 29, 2022
Published May 30, 2022 Current USERX price = 11.27, Down 44 cents (3.8%) since the last report 3 weeks ago. Introduction (repeated from prior Reports):
I have been using my unique SKI indices
to predict price changes in the precious metals' market for more
than two decades. And my indices continue to mark the critical
points. I have initiated a subscription website since 1/13/06
(yes, Friday the 13th) after having posted free updates for years
at www.321gold.com. SKI is a timing service; although
almost everyone seems to believe that market timing is impossible,
that IS what the SKI indices have done for 36 years.
The SKI indices contain short-term (16-20
trading days), intermediate-term (35-39 trading days), and long-term
(92-96 trading days) indices. A more comprehensive description
of these mathematical indices and their history is found here.
Basically, the indices compare today's price to prices from a
specified prior time period. The name of the index specifies the
time period (e.g., 92-96 index = compare today's price to prices
from 96, 95, 94, 93, and 92 trading days earlier). Although I
use the oldest gold mutual fund, USERX, for analyses, the predictions
are applicable to the broad precious metals' market. I do not
recommend or analyze specific stocks, but my subscribers from
around the world regularly discuss individual issues on our Forum.
In addition to the truly unique SKI indices, I also use "run
patterns" to guesstimate turning points in the precious metals'
market. A "run" refers to a pattern of daily up and
down market closing prices. If the market has 3 consecutive days
of higher closing prices, the run is "3 up". If prices
then decline for 2 consecutive days, the run becomes "3 up
and 2 down". If prices then close higher the next day, the
run changes to "2 down and 1 up". Some people have referred
to run patterns as "worms". A run pattern is only completed
after the direction of closing prices has changed. I have compiled
a listing of every run pattern that has ever occurred and generated
probabilities that the end of the run marks a high or a low, moderated
by the indices themselves. New Material Dedicated to the memory of my colleague, Dr. Lester C. Shine II,
who passed away during this past week near his 89th birthday.
He is the “S” in the SKI (Shine-Kern-Index) acronym.
May he rest in peace. He will be missed. He always
requested anonymity until he died.
The last SKI Report, written on 5/08/22, concluded that the gold stocks had plunged into a typically supportive 16-20 index buy and a 35-39 index sell signal to begin an intermediate-term bottoming process. The caveat was that USERX had just declined to begin moving the master 92-96 index (by 1-penny) towards a sell signal. Therefore, an immediate plunge was possible. As stated, “There’s even the very rare/special possibility of what’s called
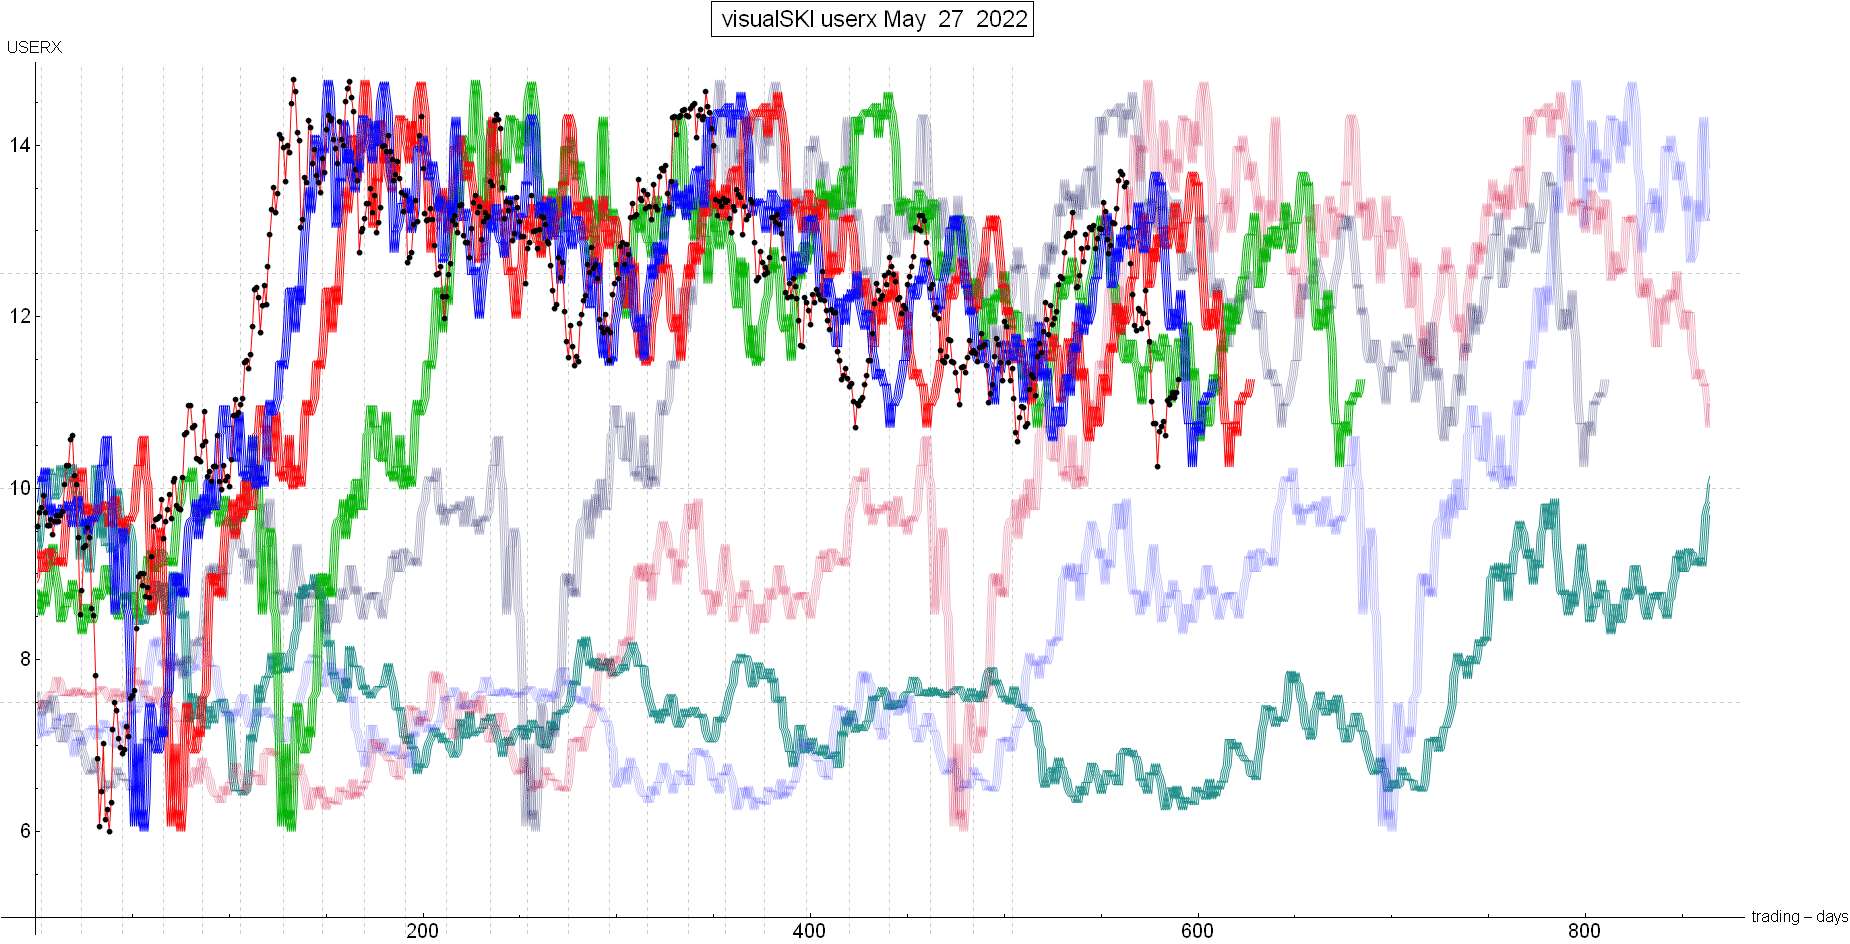
a “Life Run” low run pattern. That would require a continuous large plunge over the next at least 3 trading days to form a 2 Up and 5 or more Down (plunge) run pattern.” The instantaneous and continuing plunge occurred. USERX quickly fell to below its master 92-96 index (the green index line on the SKI chart presented below). USERX and GDXJ plunged to new 2-year lows below the late January lows of USERX 10.55 and GDXJ 36.55 on 5/12/22. The HUI DID form the special Life Run low run pattern into that new multi-year low: Its run pattern was the required 2 days Up and 6 days Down that averaged an HISTORICAL 2.5% DOWN per day into 5/12/22. Such run patterns have marked major historical multi-year lows. Unfortunately, USERX’s run down was interrupted by a 1-penny Up day on 5/11/22. Therefore, USERX did NOT form an historical multi-year Life Run low pattern. It may seem absurd that 1-penny moves in USERX can be so significant, but that routinely is the case. That’s why SKI (and you) follow USERX. I’ve described such USERX behavior hundreds of times. Therefore, the HUI’s Life Run low projected at least a multi-week rise and even a possible massive 2-year low, but USERX’s 1-penny failure to provide a Life Run low only projected an intermediate-term rise back to resistances. When USERX has manifested a Life Run low, it’s been common for it to maintain the run down even on a day when the HUI rises a little. This was the first time that the opposite has occurred: The HUI provided a Life Run low while USERX avoided a Life Run low via a tiny up-day. When the USERX 92-96 index generated Double and Triple buy signals in March 2021 and again in early February 2022 (respectively), the gold stocks rose nicely for the intermediate-term. Jeff sold rather perfectly in mid-May 2021 to capture that rise. But I waited too long to sell the February 2022 rise. During those 92-96 index buy signals, USERX would decline to hit/touch the master 92-96 index and even come within 1-day or 1-penny of going below the index. And then the rise would continue. The index was support on declines. Now, USERX went below its green line 92-96 index. Therefore, a rise back to this index should (historically) represent resistance. Here’s the current USERX SKI chart, see here. As always, the black dots are the USERX price, the green line is the 92-96 index, and the blue line is the 16-20 index. You should able to easily see that USERX has been rising into multiple hits/touches of the green line 92-96 index. USERX is also about to hit/touch its blue line 16-20 index resistance. The most common behavior is for the gold stocks to rise to above at least the declining blue line during the next week. But note how the green line is rising towards its 1/19/22 peak at 11.94. Therefore, it is perfectly feasible for the gold stocks to rise all the way up towards/above USERX 11.94 into the 2 indices’ resistance signals as GDX and GDXJ rise to fill their open down-gaps from 5/06/22-5/09/22 at 34 and 41.25, respectively (when USERX was at 11.71 as of the last SKI public Report on 5/08/22). One alternative scenario is for an instant and final plunge: The USERX run pattern is (once again) 1 day Down and 2 days Up. Therefore, a continuous plunge for 5-6 trading days would form the “missing” USERX Life Run low.I could see the likelihood of a Life Run in the last Update (3 weeks ago), but that type of plunge now is just so rare. And there’s another possible, but unusual, index pattern: A rise that only goes above the blue line for a 16-20 index sell signal and then a quick plunge to a Mechanical SKI 16-20 index true buy signal. As of today, the trend is UP, and hitting/touching indices that represent resistance. The index signals can’t generate for at least 3-4 trading days. The exact timing depends upon each day’s new closing price (the green and blue index lines on the SKI chart). The big issue is whether the HUI’s special Life Run low was THE long-term corrective low. Best Wishes on Memorial Day, Jeff If you are interested in following and learning more about the SKI indices, I'll write another Report in three weeks or you can shell out the big bucks for a SKI subscription. Weekly Updates are available by subscribing for a month (or longer if you're wise and cheap enough to want to save money) at my website www.skigoldstocks.com for the princely sum of $30 (for a one month subscription) or more ($240 for an annual subscription). I also provide more frequent intra-week daily messages/alerts at a slightly higher price along with access to our informative Forum. ###  SKI archives SKI archives
email: jeff@skigoldstocks.com
Jeffrey M. Kern,Ph.D., is an academic psychologist with a specialty in the measurement and prediction of human behavior. The communications provided are for informational purposes only and are not intended to be investment advice or recommendations for specific investment decisions. Dr. Kern is not a registered investment advisor, but is registered as a commodity trading advisor (CTA). The information provided is considered accurate, but cannot be guaranteed. Investments/trading in narrow market segments or gold futures is for individuals willing to accept a higher level of risk for the opportunity of greater returns. Past performance is no guarantee of future performance. His website is www.skigoldstocks.com.
Communications should be sent to: jeff@skigoldstocks.com.
Copyright © 2002-2024 Jeffrey Kern. All Rights Reserved.
321gold Ltd

| 