 Special SKI Report #270 Special SKI Report #270
Gold Stocks' Harsh Decline Jeffrey M. Kern, Ph.D.
Email: jeff@skigoldstocks.com
USERX | historicals
Written Sunday May 8, 2022
Published May 9, 2022 Current USERX price = 11.71, Down a huge $1.98 (14.5%) since the last report 3 weeks ago. Introduction (repeated from prior Reports):
I have been using my unique SKI indices
to predict price changes in the precious metals' market for more
than two decades. And my indices continue to mark the critical
points. I have initiated a subscription website since 1/13/06
(yes, Friday the 13th) after having posted free updates for years
at www.321gold.com. SKI is a timing service; although
almost everyone seems to believe that market timing is impossible,
that IS what the SKI indices have done for 36 years.
The SKI indices contain short-term (16-20
trading days), intermediate-term (35-39 trading days), and long-term
(92-96 trading days) indices. A more comprehensive description
of these mathematical indices and their history is found here.
Basically, the indices compare today's price to prices from a
specified prior time period. The name of the index specifies the
time period (e.g., 92-96 index = compare today's price to prices
from 96, 95, 94, 93, and 92 trading days earlier). Although I
use the oldest gold mutual fund, USERX, for analyses, the predictions
are applicable to the broad precious metals' market. I do not
recommend or analyze specific stocks, but my subscribers from
around the world regularly discuss individual issues on our Forum.
In addition to the truly unique SKI indices, I also use "run
patterns" to guesstimate turning points in the precious metals'
market. A "run" refers to a pattern of daily up and
down market closing prices. If the market has 3 consecutive days
of higher closing prices, the run is "3 up". If prices
then decline for 2 consecutive days, the run becomes "3 up
and 2 down". If prices then close higher the next day, the
run changes to "2 down and 1 up". Some people have referred
to run patterns as "worms". A run pattern is only completed
after the direction of closing prices has changed. I have compiled
a listing of every run pattern that has ever occurred and generated
probabilities that the end of the run marks a high or a low, moderated
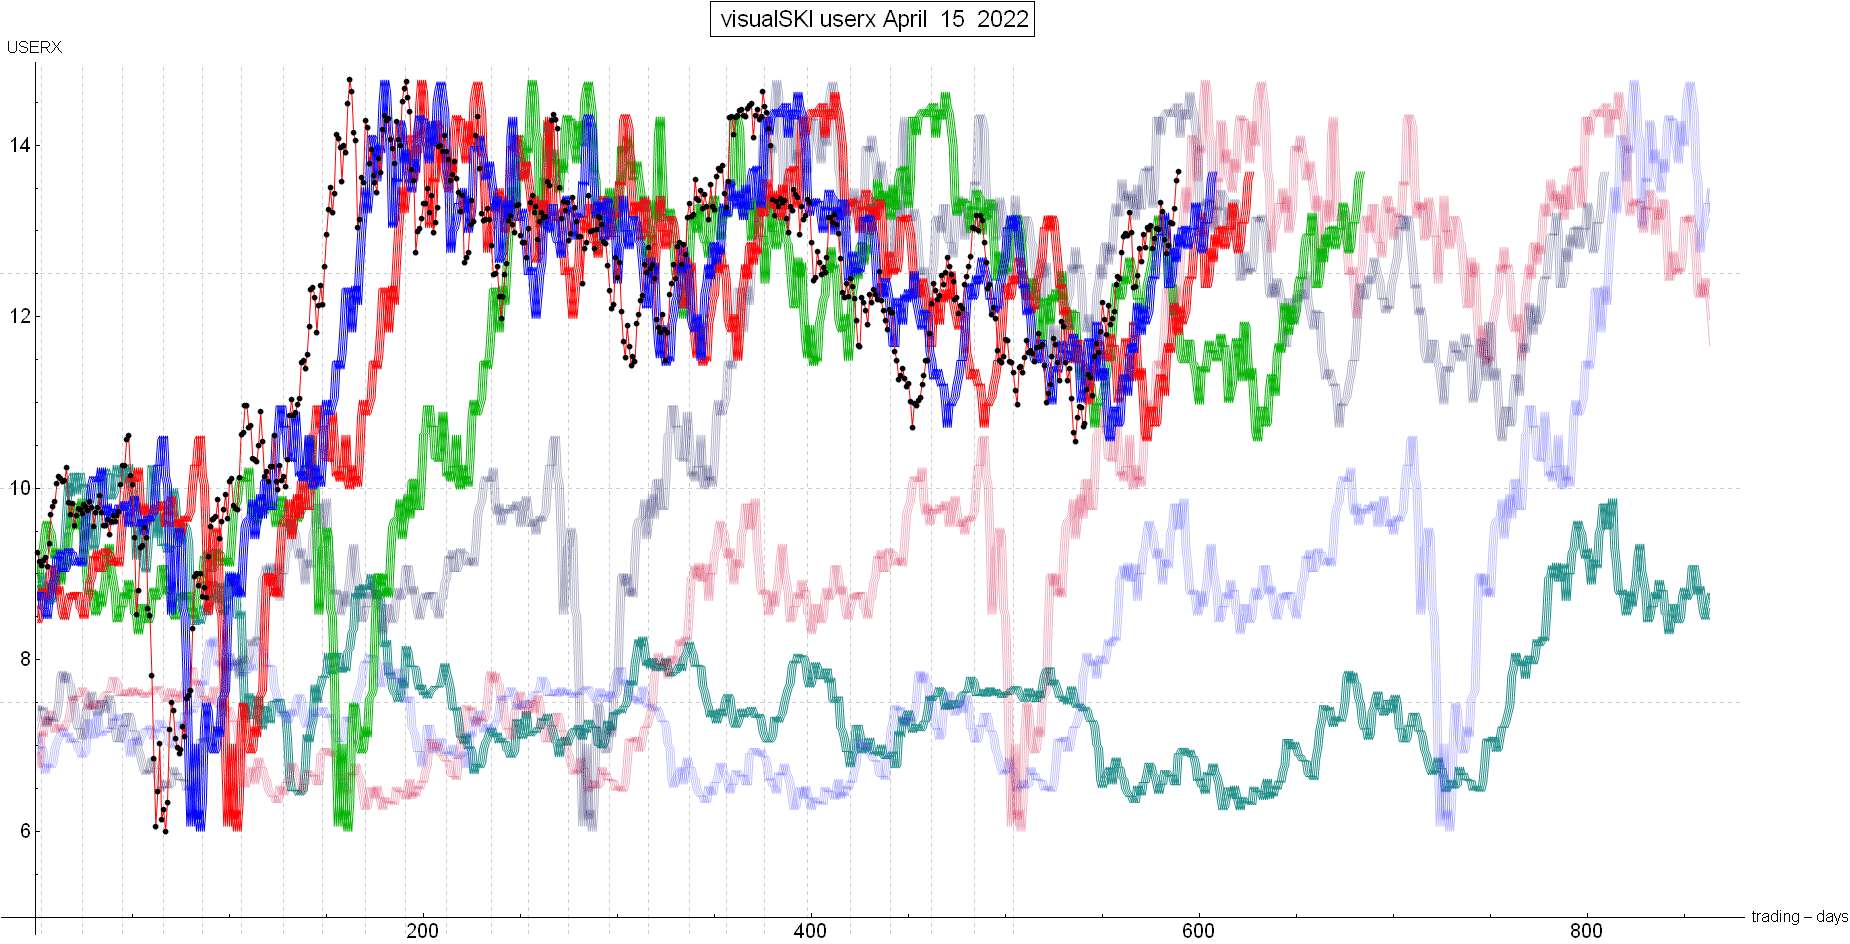
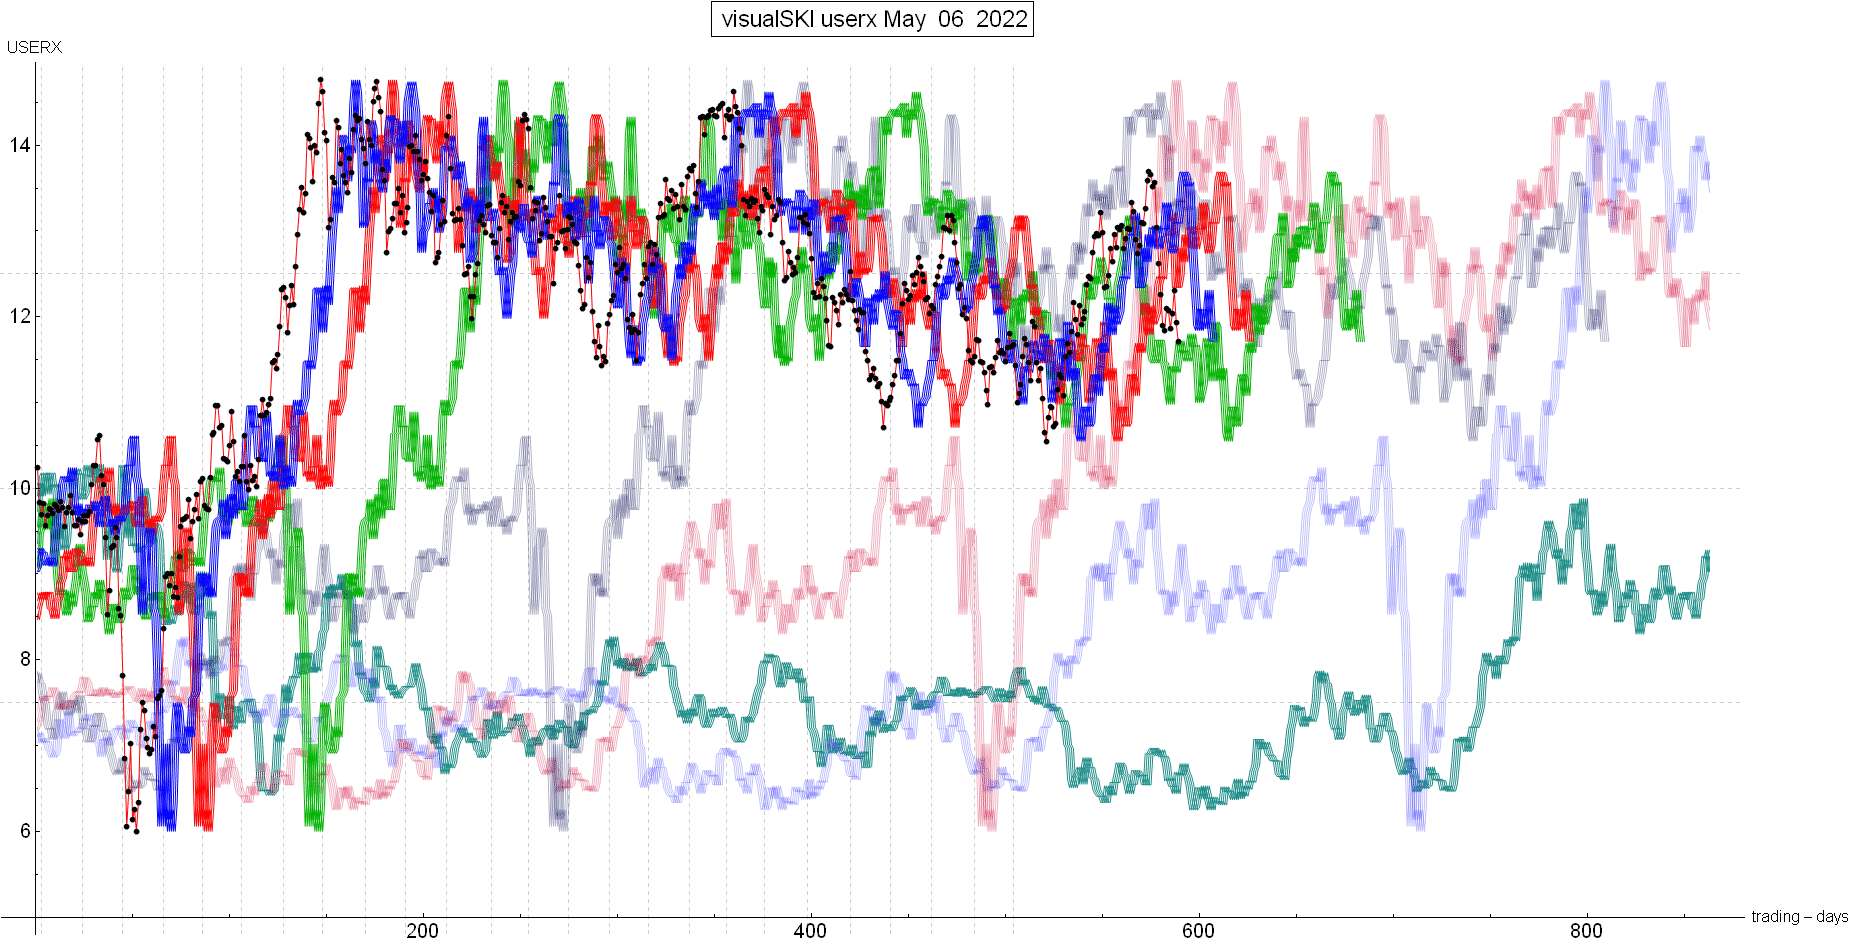
by the indices themselves. New Material The last SKI Report, written on 4/17/22, was continuing bullish from SKI’s 2/10/22 Triple Buy signal pattern at USERX 11.08-11.54. The master 92-96 index HAD sold on 4/01/22 at 13.33 on an exact “cycle date” for a high, but it had surprisingly instantly re-bought the next day. The SKI index chart showed how USERX (the back dots) was now riding the long-term 442 index (the faded red index line): see here. The Report concluded that “USERX should now rise to stay above the faded red line index line (the prices from 439-443 trading days ago) AND go to the faded purple line (the prices from 218-222 trading days ago). Those are the highs from August 2020 and May-June 2021”. During the 2 trading days following the last Report, the gold stocks declined. USERX only declined to 13.52 on 4/19/22. The 439-443 index’s prices on that day had risen to USERX 12.14, 12.58, 12.96, 13.25, and 13.51. Therefore, USERX had somehow remained 1-penny above the index’s back prices. It all continued to be bullish when the gold stocks rose slightly on 4/20/22 to USERX 13.57. And then the unexpected and harsh decline began. On 4/20/22, the gold stocks suddenly began to be affected (negatively) by the decline in the general stock market. USERX plunged to 13.04. That smashed the 439-443 index towards a sell signal as USERX fell below 3 of the index’s 5 back prices that were at 12.96, 13.25, 13.51, 13.21, and 13.44. That wasn’t “supposed to” happen. Now, the harsh decline went down below the 16-20 index’s prices to execute a SUPPORTIVE 16-20 index buy on 4/26/22 at USERX 11.90. The decline also generated a 35-39 index “sell” signal. That index pattern usually marks the beginning of an intermediate-term bottoming PROCESS. That process can take up to 35-39 trading days before the 35-39 index re-buys for another intermediate-term rise. Hence, that process takes patience. The caveat (short-term bearish alternative) is that this past Friday’s (5/06/22) decline reached the master 92-96 index by 1-penny. When USERX declined to 11.71, it hit/touched the 92-96 index’s back prices that were peaking at 11.42, 11.35, 11.52, 11.72, and 11.58. Therefore, I can’t be sure that the plunge won’t continue over the next 3-4 trading days. The situation is once again depicted in the current chart of the SKI indices. The 92-96 index is the green line and the black dots are USERX’s prices: see here. There’s even the very rare/special possibility of what’s called a “Life Run” low run pattern. That would require a continuous large plunge over the next at least 3 trading days to form a 2 Up and 5 or more Down (plunge) run pattern. I never like it when the gold stocks are affected by a “risk-off” plunge in the general stock market and almost all market segments decline simultaneously for a potential “liquidity crisis”. You may be surprised that since I began public posting on 1/02/2000, gold and USERX (plus dividends) have outperformed the S@P 500 (plus dividends). SKI is most useful for catching the multi-month to 1-year large rises in the gold stocks. Personally, I usually use 20-40% of my net worth on solid index buy patterns, as occurred on 2/10/2022… Best Wishes on Mother’s Day, Jeff If you are interested in following and learning more about the SKI indices, I'll write another Report in three weeks or you can shell out the big bucks for a SKI subscription. Weekly Updates are available by subscribing for a month (or longer if you're wise and cheap enough to want to save money) at my website www.skigoldstocks.com for the princely sum of $30 (for a one month subscription) or more ($240 for an annual subscription). I also provide more frequent intra-week daily messages/alerts at a slightly higher price along with access to our informative Forum. ###  SKI archives SKI archives
email: jeff@skigoldstocks.com
Jeffrey M. Kern,Ph.D., is an academic psychologist with a specialty in the measurement and prediction of human behavior. The communications provided are for informational purposes only and are not intended to be investment advice or recommendations for specific investment decisions. Dr. Kern is not a registered investment advisor, but is registered as a commodity trading advisor (CTA). The information provided is considered accurate, but cannot be guaranteed. Investments/trading in narrow market segments or gold futures is for individuals willing to accept a higher level of risk for the opportunity of greater returns. Past performance is no guarantee of future performance. His website is www.skigoldstocks.com.
Communications should be sent to: jeff@skigoldstocks.com.
Copyright © 2002-2024 Jeffrey Kern. All Rights Reserved.
321gold Ltd

| 