 Special SKI Report #170 Special SKI Report #170
Gold Stock Update Jeffrey M. Kern, Ph.D.
Email: jeff@skigoldstocks.com
USERX | historicals
Written Sunday May 29, 2016
Published May 30, 2016 Current USERX price = 7.67, Down 72 cents (8.6%) since the last report 3 weeks ago. Introduction (repeated from prior Reports):
I have been using my unique SKI indices
to predict price changes in the precious metals' market for more
than two decades. And my indices continue to mark the critical
points. I have initiated a subscription website since 1/13/06
(yes, Friday the 13th) after having posted free updates for years
at www.321gold.com. SKI is a timing service; although
almost everyone seems to believe that market timing is impossible,
that IS what the SKI indices have done for 36 years.
The SKI indices contain short-term (16-20
trading days), intermediate-term (35-39 trading days), and long-term
(92-96 trading days) indices. A more comprehensive description
of these mathematical indices and their history is found here.
Basically, the indices compare today's price to prices from a
specified prior time period. The name of the index specifies the
time period (e.g., 92-96 index = compare today's price to prices
from 96, 95, 94, 93, and 92 trading days earlier). Although I
use the oldest gold mutual fund, USERX, for analyses, the predictions
are applicable to the broad precious metals' market. I do not
recommend or analyze specific stocks, but my subscribers from
around the world regularly discuss individual issues on our Forum.
In addition to the truly unique SKI indices, I also use "run
patterns" to guesstimate turning points in the precious metals'
market. A "run" refers to a pattern of daily up and
down market closing prices. If the market has 3 consecutive days
of higher closing prices, the run is "3 up". If prices
then decline for 2 consecutive days, the run becomes "3 up
and 2 down". If prices then close higher the next day, the
run changes to "2 down and 1 up". Some people have referred
to run patterns as "worms". A run pattern is only completed
after the direction of closing prices has changed. I have compiled
a listing of every run pattern that has ever occurred and generated
probabilities that the end of the run marks a high or a low, moderated
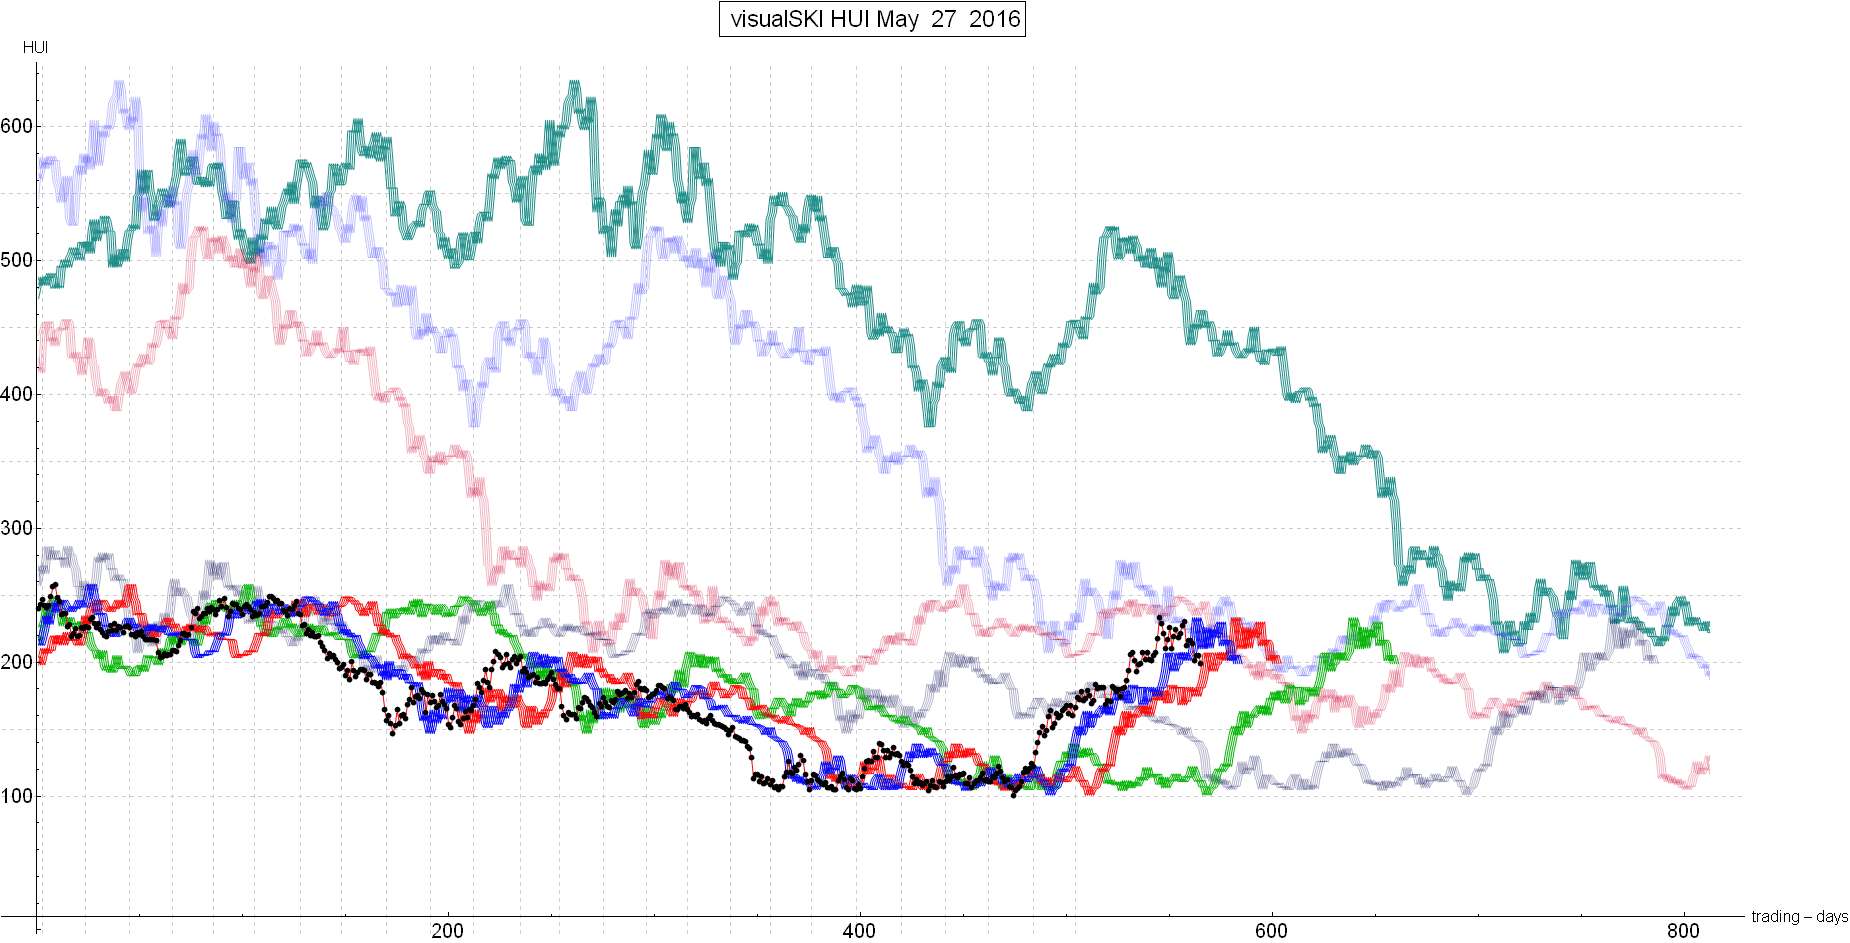
by the indices themselves. New Material The last SKI Report, written on Sunday 5/08/16, described the history of the SKI bull market from the 1/24/16 master 92-96 index buy signal and focused on the new information from the long-term indices: The 221 index had bought on 2/08/16 at USERX 5.96 to initiate a potential multi-year rise, then the 442 index had bought on 4/28/16, and then the 663 index had sold the next day (4/29/16). The ordering of the index signals was long-term bullish, but the 663 index’s sell signal had marked the exact high (at that time) at USERX 8.49. That last SKI Report concluded that “Now, the 663 index’s sell signal on 4/29/16 at USERX 8.49 could have marked the exact high and any close over 8.49 should initiate the next portion of the ‘melt-up phase’.” THE 663 INDEX’S SELL SIGNAL ON 4/29/16 HAS CONTINUED TO MARK THE EXACT CLOSING HIGH-TO-DATE FOR MANY GOLD MEASURES (e.g., the HUI, GDX, GLD; SKI only deals with daily closing prices). However, on 5/16/16 and 5/17/16, USERX did rise over that important 8.49 closing price for two trading days and it looked like a break-out to the upside (although most measures did NOT make a new closing high). And then, on 5/18/16, the release of the minutes from the prior U.S. Federal Reserve meeting was followed by a significant decline in the precious metals. Therefore, the prior SKI Report’s conclusion was wrong. That shouldn’t have affected SKIers who had been bullish since 1/24/16-1/25/16 and then again on a 16-20 index buy signal at the exact low on 4/04/16: Jeff wasn’t saying to “buy” that apparent and incorrect breakout because we were still long. During the “melt-up phase” of SKI bull markets, all of the historical analogues indicated that any hits/touches of the 16-20 index have yielded short-term declines into that index’s buy signal. I know that’s hard to understand if you are not familiar with SKI. But that historical guideline indicated that after the harsh decline on 5/18/16, if USERX wasn’t back over 8.49 on Monday (5/23/16), the 16-20 index would be hit/touched and a decline should follow. So Jeff sold 50% last Monday (5/23/16) at USERX 8.25 because it was obvious that the gold stocks were not rising enough to get over USERX 8.49. Prices plunged the following day (5/24/16) in SKI-perfection. The historically-based prediction had to be that prices would decline into a 16-20 index buy signal on Friday (5/27/16). Conclusion The short-term prediction for a decline into this past Friday was rather accurate (smile). We’ll see if this past Friday’s 16-20 index buy signal marked the exact corrective low for the second time this year. Jeff bought gold stocks at the Friday close. Although SKI has been incredibly accurate this year, it is not perfect, and the gold stocks could decline further into the 35-39 index and may even have begun the “horrendous decline” that was described in the previous 321gold SKI Report. The only thing that matters is the sell-stop to manage risk. When the next public SKI Report is published in 3 weeks, it should be obvious whether this new 16-20 index buy signal was validly bullish. The HUI continues to be repelled by its long-term SKI indices (the faded red and faded purple lines in this SKI chart; the black dots are the HUI closing prices; see how the HUI went up to hit those long-term index lines and got repelled again?; and the HUI has also declined to below the blue line for a 16-20 index buy signal. Best Wishes, Jeff If you are interested in following and learning more about the SKI indices, I'll write another Report in three weeks or you can shell out the big bucks for a SKI subscription. Weekly Updates are available by subscribing for a month (or longer if you're wise and cheap enough to want to save money) at my website www.skigoldstocks.com for the princely sum of $25 (for a one month subscription) or more ($200 for an annual subscription). I also provide more frequent intra-week messages/alerts at a slightly higher price along with access to our informative Forum and a managed gold futures program. The precious metals are in a very long-term (decade+) up-trend but are the most precarious, volatile, and psychologically difficult market in the world (in my opinion). That's the way it's always been. ###  SKI archives SKI archives
email: jeff@skigoldstocks.com
Jeffrey M. Kern,Ph.D., is an academic psychologist with a specialty in the measurement and prediction of human behavior. The communications provided are for informational purposes only and are not intended to be investment advice or recommendations for specific investment decisions. Dr. Kern is not a registered investment advisor, but is registered as a commodity trading advisor (CTA). The information provided is considered accurate, but cannot be guaranteed. Investments/trading in narrow market segments or gold futures is for individuals willing to accept a higher level of risk for the opportunity of greater returns. Past performance is no guarantee of future performance. His website is www.skigoldstocks.com.
Communications should be sent to: jeff@skigoldstocks.com.
Copyright © 2002-2024 Jeffrey Kern. All Rights Reserved. 321gold Ltd

|
