 Special SKI Report #169 Special SKI Report #169
Gold Stock Update: Yes, Melt-Up, But... Jeffrey M. Kern, Ph.D.
Email: jeff@skigoldstocks.com
USERX | historicals
Written Sunday May 08, 2016
Published May 09, 2016 Current USERX price = 8.39, Up $1.04 (another 14%) since the last report 3 weeks ago. Introduction (repeated from prior Reports):
I have been using my unique SKI indices
to predict price changes in the precious metals' market for more
than two decades. And my indices continue to mark the critical
points. I have initiated a subscription website since 1/13/06
(yes, Friday the 13th) after having posted free updates for years
at www.321gold.com. SKI is a timing service; although
almost everyone seems to believe that market timing is impossible,
that IS what the SKI indices have done for 36 years.
The SKI indices contain short-term (16-20
trading days), intermediate-term (35-39 trading days), and long-term
(92-96 trading days) indices. A more comprehensive description
of these mathematical indices and their history is found here.
Basically, the indices compare today's price to prices from a
specified prior time period. The name of the index specifies the
time period (e.g., 92-96 index = compare today's price to prices
from 96, 95, 94, 93, and 92 trading days earlier). Although I
use the oldest gold mutual fund, USERX, for analyses, the predictions
are applicable to the broad precious metals' market. I do not
recommend or analyze specific stocks, but my subscribers from
around the world regularly discuss individual issues on our Forum.
In addition to the truly unique SKI indices, I also use "run
patterns" to guesstimate turning points in the precious metals'
market. A "run" refers to a pattern of daily up and
down market closing prices. If the market has 3 consecutive days
of higher closing prices, the run is "3 up". If prices
then decline for 2 consecutive days, the run becomes "3 up
and 2 down". If prices then close higher the next day, the
run changes to "2 down and 1 up". Some people have referred
to run patterns as "worms". A run pattern is only completed
after the direction of closing prices has changed. I have compiled
a listing of every run pattern that has ever occurred and generated
probabilities that the end of the run marks a high or a low, moderated
by the indices themselves. New Material
The last SKI Report, written on Sunday 4/17/16, was titled "Melt-Up or Melt-Down?" because there never is 100% certainty, but the Report concluded that a rise over the 16-20 index's sell signal from 4/12/16 at USERX 7.42 would initiate a melt-up phase into a major high. That high would not necessarily end the longer-term (multi-year) bull market if the SKI long-term indices generated the needed signals, but I reserved those long-term index details for SKIers. I was concerned that my subscribers would be upset that I provided such a specific 16-20 index prediction, but I did not want readers here to miss the beginning of the "melt-up" phase after having missed the beginning of the SKI bull market buy signals on 1/25/16.
The day that Report was published on 321gold (4/18/16), USERX DID close over 7.42 by one penny. THE "MELT-UP" PHASE (or "Blow-Off Top" Phase) HAD COMMENCED. The next upside target were those long-term 442 and 663 indices.
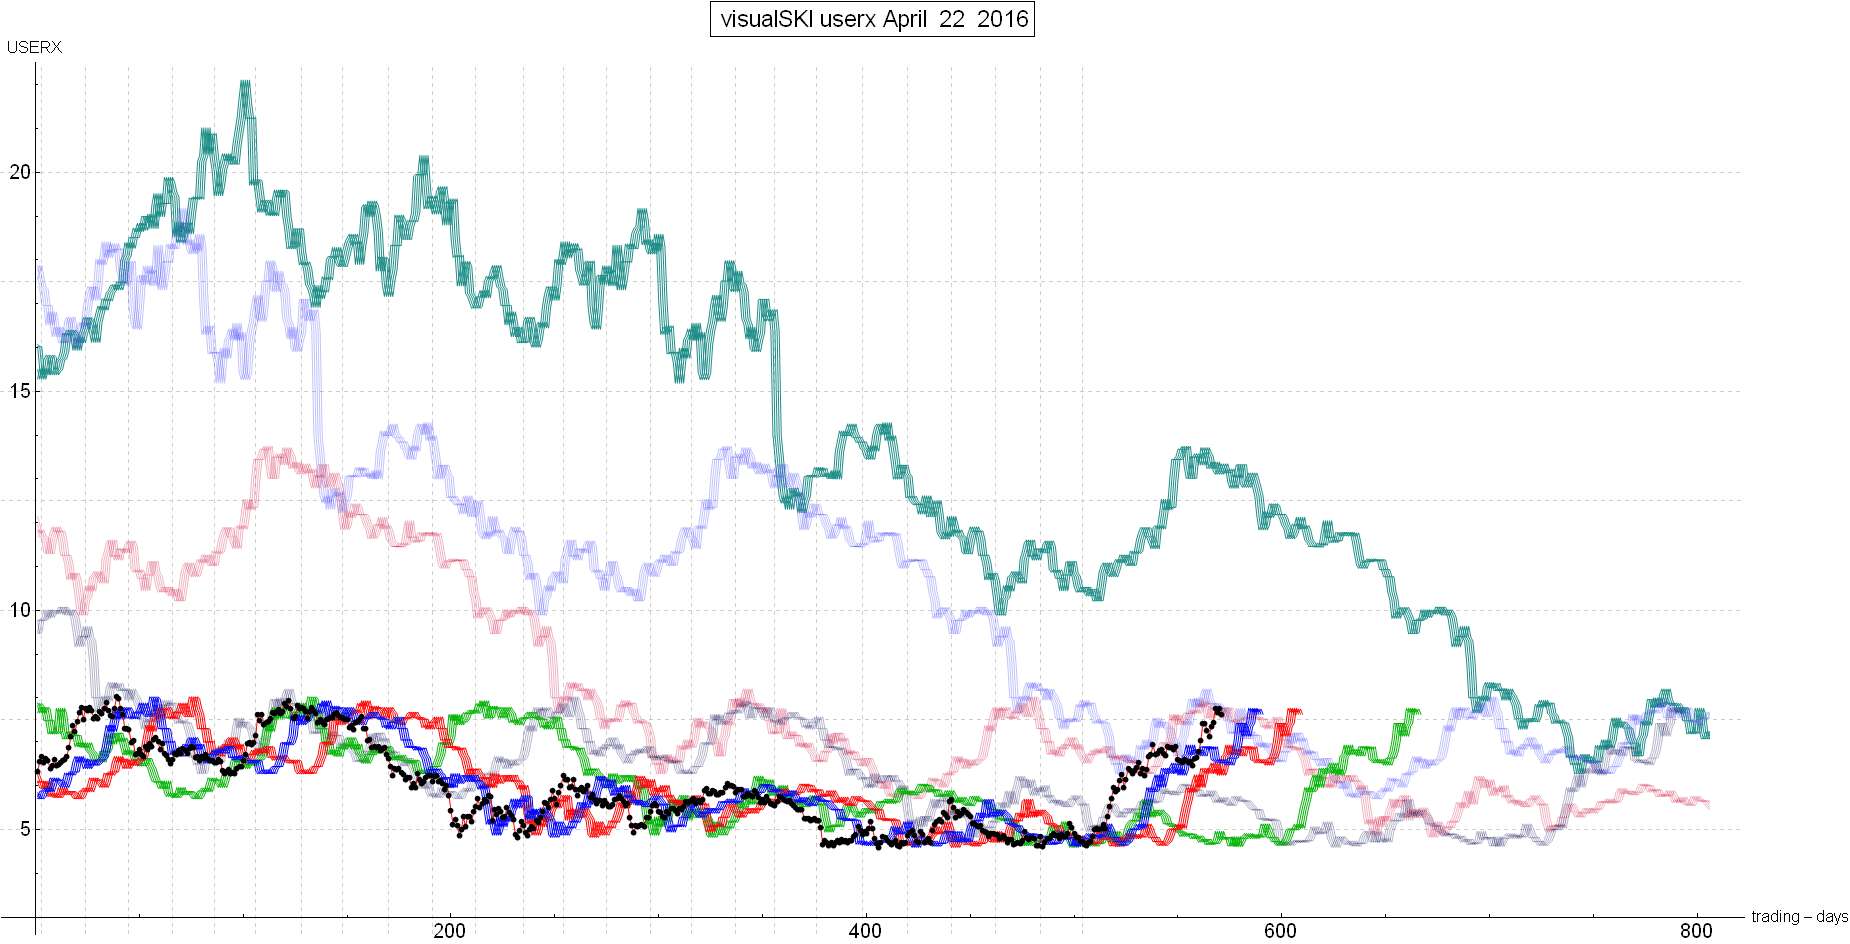
The rise carried USERX up to 7.70 on the day before the U.S. Federal Reserve announcement on 4/27/16. And yes, the long-term USERX SKI indices were being hit/touched (reached). Here's the pictorial presentation of the SKI indices at that time: http://www.imageshack.com/a/img923/2778/xojK4i.gif(Use Control+ to enlarge; if the link does not work, then copy and paste it in your browser; Legend: blue: 16-20 index, red: 35-39 index, green: 92-96 index
faded purple: 221 index, faded red: 442 index, faded blue: 663 index, turquoise: 884 index).
The long-term indices are the inverse of the regular SKI 92-96, 35-39, and 16-20 indices. For the regular SKI indices, the 92-96 index is the master bull market index, the 35-39 index is intermediate-term index, and the 16-20 index is the short-term index that buys on decline and sells on rises. In late January, the 92-96 index bought first for a bull market, the 35-39 index bought the next day for a powerful Double Buy, and the 16-20 index sold the following day. That was one of the most powerful index bull market patterns possible and forecast a "straight-rise up" into an eventual "melt-up" phase.
For the long-term indices, the 221 index is the master bull market index (the equivalent of the 92-96 index), the 442 index is the intermediate-term index (equivalent to the 35-39 index), and the 663 index is the short-term index that sells on rises and buys on declines (equivalent to the 16-20 index).
The order of the index signals is important: The January bull market had the perfect bullish ordering, as reported several weeks later on 321gold. The master 92-96 index bought first, the intermediate 35-39 index bought next, and then the 16-20 index sell signal (that should be exploded through to the upside IF the bull market buy signal was correct). It's the same for the long-term indices: The very bullish index pattern is for the master 221 index to buy first, then the 442 index, and then the 663 index's sell signal.
You should be able to see how USERX went over the 221 index (the faded purple line) on 2/08/16 for the potential long-term bull market. Now, we needed USERX to rise over the 442 next BEORE rising over the 663 index, to provide the most bullish long-term index pattern equivalent to the regular indices. The above SKI chart shows that USERX was extremely close to going over the 442 and 663 indices, but unless you do the simple mathematical computation of the indices, you probably cannot discern the ordering.
When USERX rose a few pennies on the day of the U.S. Federal Reserve announcement, the 442 index DID generate its buy signal and Jeff sent the special Intra-Week Update. The gold stocks then exploded again the next day, generated the 663 index's sell signal, and then exploded again the following day into the 663 index's sell signal on 4/29/16 at USERX 8.49.
It was most pleasing to see that indices from 2 and 3 years ago were accurate to the day! The indices had been validated again! It's still amazing to Jeff and my colleague every time this happens...
Conclusion
The long-term indices generated their bullish SKI index pattern and the conclusion is therefore the same as the prior SKI Report. That prior Report concluded that a rise over the 16-20 index sell signal could have marked the exact high OR any close over that index sell signal would initiate the expected "melt-up" rise. The 4/18/16 1-penny USERX close over 7.42 did yield the predicted melt-up. Now, the 663 index's sell signal on 4/29/16 at USERX 8.49, could have marked the exact high and any close over 8.49 should initiate the next portion of the "melt-up phase". SKIers were provided with the history of every melt-up phase since 1974 some 3 weeks ago so that we could try to time the important top. At this point, if the 663 index's sell signal marked the exact high, it would be the shortest and smallest "melt-up" in history, so Jeff remains bullish.
When the "melt-up" phase ends, history indicates that the decline should be quite horrendous and go back down to a 92-96 index sell signal that ends the 92-96 index's bull market buy signal from January. And then another rise is supposed to occur because the very long-term indices are bullish. Long-termers can remain bullish, but very few people will have the stomach or the desire to remain long during a major decline (that should exceed most analysts' expectations) when the melt-up phase ends and the gold stocks decline into a 92-96 index sell signal over months.
There's never a "guarantee", but this WAS the prediction from January (as reported to 321gold; http://www.321gold.com/editorials/kern/kern021516.html). It has (so far) been one of the most perfect SKI predictions in 30 years, and melt-up phases have ended ALL 92-96 index SKI bull markets since 1974. Although a larger melt-up phase continues to be expected shortly, I've got my objective sell-stop (reserved for subscribers) in case the 663 index's sell signal marked the exact high.
Cheers, Jeff
If you are interested in following and learning more about the SKI indices, I'll write another Report in three weeks or you can shell out the big bucks for a SKI subscription. Weekly Updates are available by subscribing for a month (or longer if you're wise and cheap enough to want to save money) at my website www.skigoldstocks.comfor the princely sum of $25 (for a one month subscription) or more ($200 for an annual subscription). I also provide more frequent intra-week messages/alerts at a slightly higher price along with access to our informative Forum and a managed gold futures program. The precious metals are in a very long-term (decade+) up-trend but are the most precarious, volatile, and psychologically difficult market in the world (in my opinion). That's the way it's always been.
###  SKI archives SKI archives
email: jeff@skigoldstocks.com
Jeffrey M. Kern,Ph.D., is an academic psychologist with a specialty in the measurement and prediction of human behavior. The communications provided are for informational purposes only and are not intended to be investment advice or recommendations for specific investment decisions. Dr. Kern is not a registered investment advisor, but is registered as a commodity trading advisor (CTA). The information provided is considered accurate, but cannot be guaranteed. Investments/trading in narrow market segments or gold futures is for individuals willing to accept a higher level of risk for the opportunity of greater returns. Past performance is no guarantee of future performance. His website is www.skigoldstocks.com.
Communications should be sent to: jeff@skigoldstocks.com.
Copyright © 2002-2024 Jeffrey Kern. All Rights Reserved. 321gold Ltd

| 