 Special SKI Report #269 Special SKI Report #269
Gold Stocks' Renewed Bullishness Jeffrey M. Kern, Ph.D.
Email: jeff@skigoldstocks.com
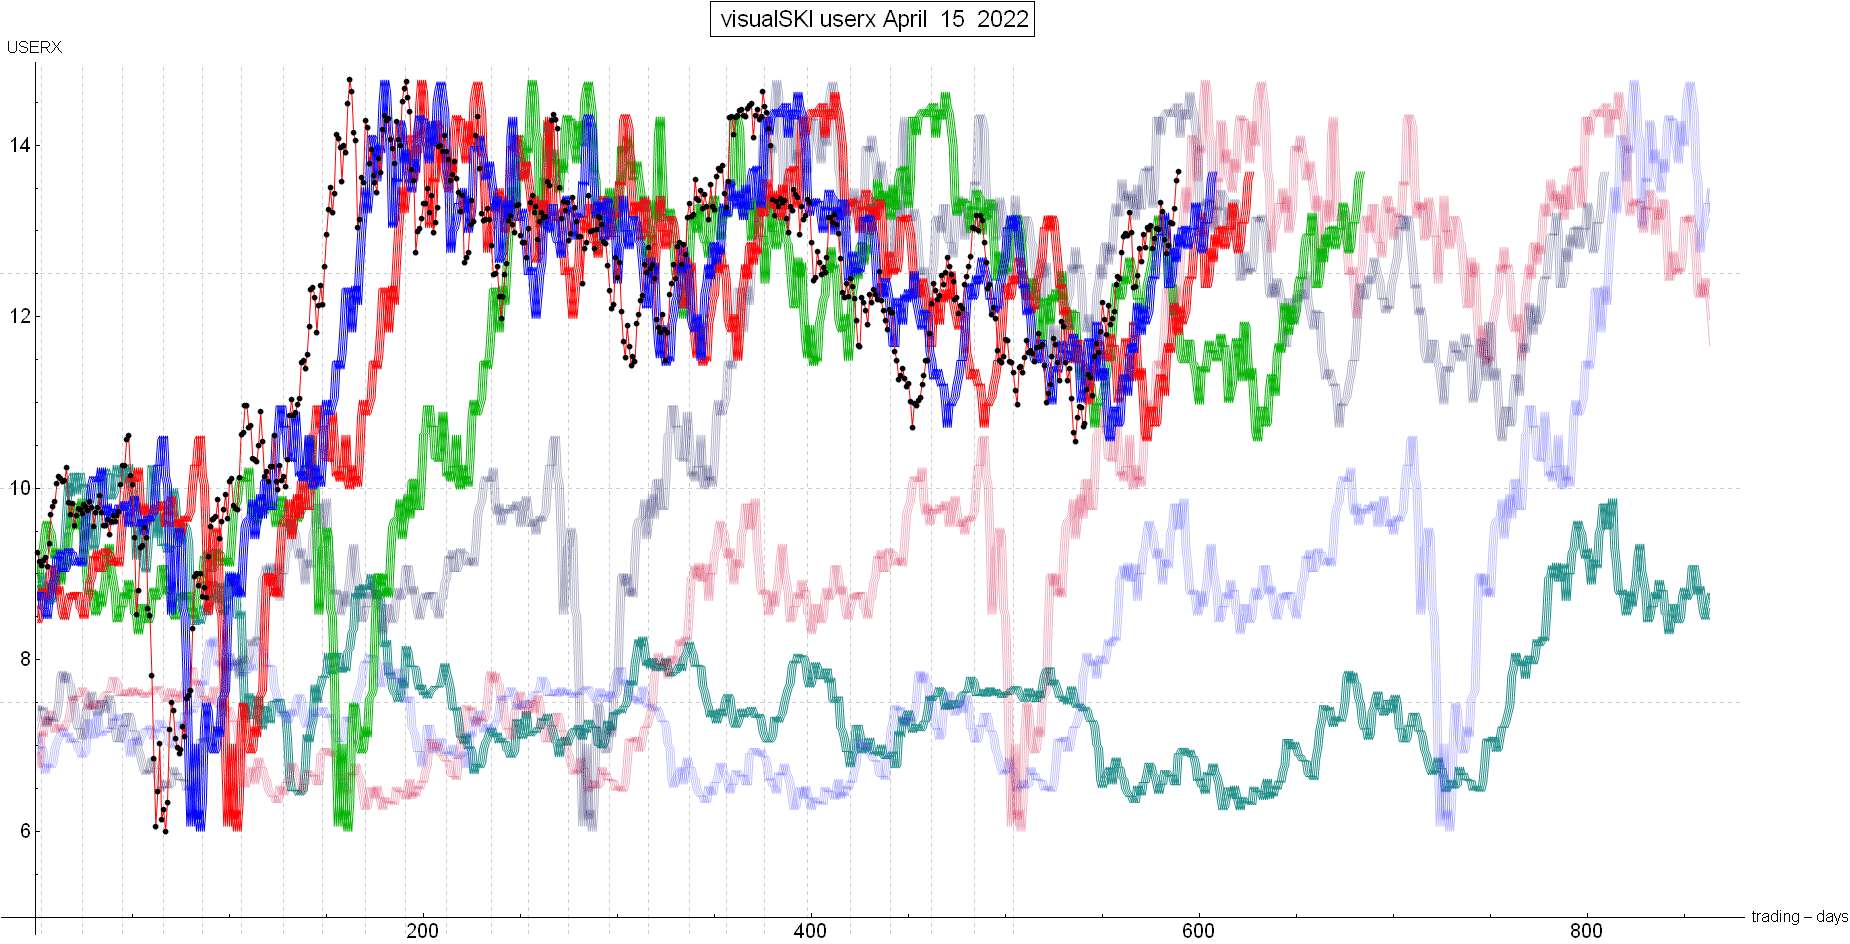
USERX | historicals
Written Sunday Apr 17, 2022
Published Apr 18, 2022 Current USERX price = 13.69, Up another 63 cents (4.8%) since the last report 3 weeks ago. Introduction (repeated from prior Reports):
I have been using my unique SKI indices
to predict price changes in the precious metals' market for more
than two decades. And my indices continue to mark the critical
points. I have initiated a subscription website since 1/13/06
(yes, Friday the 13th) after having posted free updates for years
at www.321gold.com. SKI is a timing service; although
almost everyone seems to believe that market timing is impossible,
that IS what the SKI indices have done for 36 years.
The SKI indices contain short-term (16-20
trading days), intermediate-term (35-39 trading days), and long-term
(92-96 trading days) indices. A more comprehensive description
of these mathematical indices and their history is found here.
Basically, the indices compare today's price to prices from a
specified prior time period. The name of the index specifies the
time period (e.g., 92-96 index = compare today's price to prices
from 96, 95, 94, 93, and 92 trading days earlier). Although I
use the oldest gold mutual fund, USERX, for analyses, the predictions
are applicable to the broad precious metals' market. I do not
recommend or analyze specific stocks, but my subscribers from
around the world regularly discuss individual issues on our Forum.
In addition to the truly unique SKI indices, I also use "run
patterns" to guesstimate turning points in the precious metals'
market. A "run" refers to a pattern of daily up and
down market closing prices. If the market has 3 consecutive days
of higher closing prices, the run is "3 up". If prices
then decline for 2 consecutive days, the run becomes "3 up
and 2 down". If prices then close higher the next day, the
run changes to "2 down and 1 up". Some people have referred
to run patterns as "worms". A run pattern is only completed
after the direction of closing prices has changed. I have compiled
a listing of every run pattern that has ever occurred and generated
probabilities that the end of the run marks a high or a low, moderated
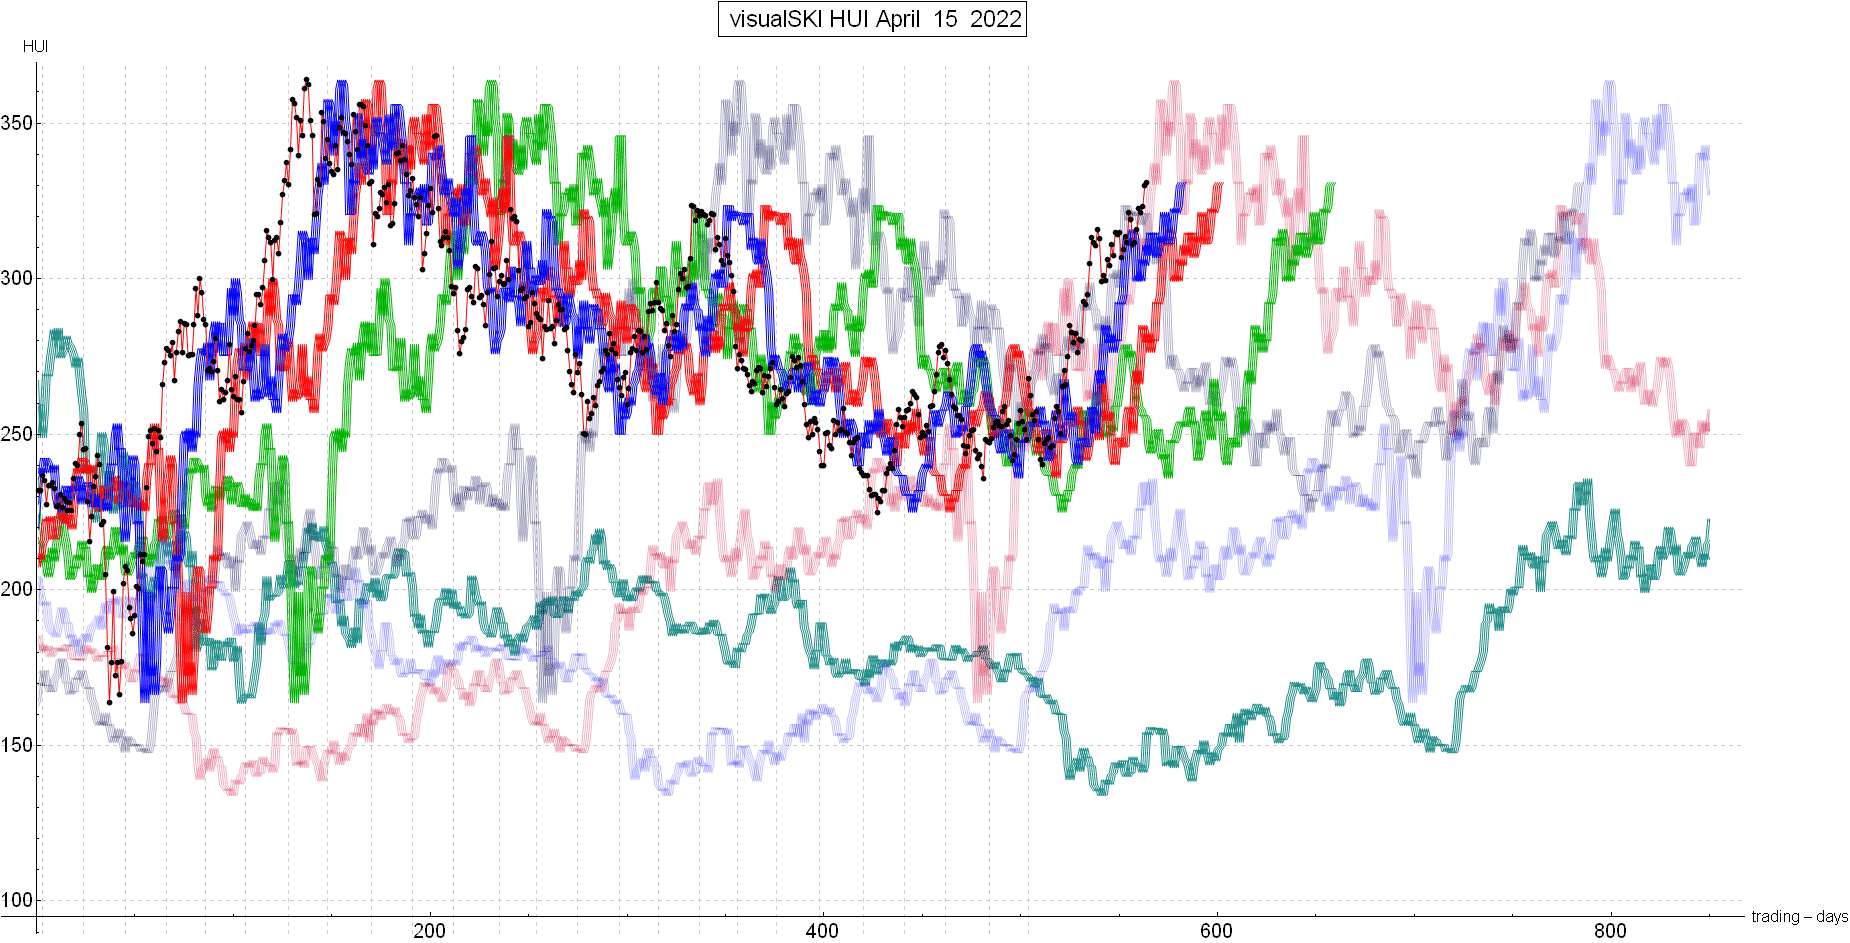
by the indices themselves. New Material The last SKI Report, written on 3/27/22, described how the historically bullish Triple Buy index pattern had remained intact and how USERX had kept barely staying above the master SKI 92-96 index to maintain that bullishness. On the bearish side, the initial upside price target was being reached AND the time frame for some type of cycle top was being reached to within 1 week. The time frame was based upon peaks in the 92-96 index and the longer-term 221 index in one more week. I tried to emphasize that one should not seek answers to “why” questions nor should one try to predict the gold stocks (or gold) based upon other market segments. The gold stocks then declined and just barely (by USERX 2-pennies) generated a 92-96 index mathematical sell-stop sell signal on Thursday (3/31/22) as USERX closed at 13.02. Index signals execute one trading day after the signal generates. Quite importantly, a rise back above USERX 13.18 the next day (4/01/22) would generate an instant new potential bull buy 92-96 index buy signal. I’ll refrain from using exclamation points, but the gold stocks surged higher on 4/01/22 to USERX 13.33. Therefore, Mechanical SKI sold at 13.33 but also generated a bull market buy signal for execution on the next trading day (4/04/22). Again, don’t ask “how or why” the indices and Nature can do such things so exactly. It is “typical/common”. The 4/01/22 potential high was the exact “cycle date”. The ensuing brief decline once again kept threatening to sell-stop the new 92-96 index’s buy signal into 4/06/22-4/07/22 at USERX 12.74 and 12.83. And then the rise renewed. Last week’s rise took USERX and the HUI (GDX) to new multi-month highs for another “bullish break-out”. Perhaps this weekend’s SKI charts for USERX and the HUI will be helpful for folks who refrain from subscribing to receive the daily or weekend SKI Updates. Jeff provides exact prices needed to generate index signals that are much easier to follow (and are more mathematically precise) than these charts. Nonetheless, the USERX and HUI prices are the black dots. The 92-96 index is the green line and the supportive 16-20 index is the blue line. Click on the link(s) and then click the displayed chart to enlarge it. Here's the USERX’s SKI chart. You should be able to see how USERX made a 1.5 year low near the end of January 2022. That WAS the time point when the precious metals complex began the major rise, even as other measures had previously bottomed at a slightly lower price. I point this out because USERX (the “world-wide” measure) is, again, THE measure to follow. Anyway, can you see how USERX should now rise to stay above the faded red line index line (the prices from 439-443 trading days ago) AND go to the faded purple line (the prices from 218-222 trading days ago)? How does Nature (the market) make them peak at the just about the same time? Those are the highs from August 2020 and May-June 2021. Here’s the HUI’s SKI chart. The HUI has been stronger than USERX because the U.S. Dollar has been rising and USERX has gold/silver stocks denominated in Canadian Dollars, Australian Dollars, and other foreign currencies. The HUI is “riding” its faded red 442 index line higher. I’m just a scientist and a retired clinical psychologist. Everything that one does, financially or otherwise, entails risk. On this religious-holiday weekend, family and morality remain most important. Yet, the SKI Triple Buy suggests that survival is an issue. Money is needed for survival, but I doubt that Jeff Bezos or Elon Musk are happier than I am. Money only has a small correlation with happiness. I’ve never been a “business-person” or good “advertiser”. You won’t believe me, but a major portion of my happiness has been to “help others”. IMO, the internet and the media are filled with non-scientific “garbage” and western societies are deteriorating. Hoping that this is helpful. Best Wishes, Jeff If you are interested in following and learning more about the SKI indices, I'll write another Report in three weeks or you can shell out the big bucks for a SKI subscription. Weekly Updates are available by subscribing for a month (or longer if you're wise and cheap enough to want to save money) at my website www.skigoldstocks.com for the princely sum of $30 (for a one month subscription) or more ($240 for an annual subscription). I also provide more frequent intra-week daily messages/alerts at a slightly higher price along with access to our informative Forum. ###  SKI archives SKI archives
email: jeff@skigoldstocks.com
Jeffrey M. Kern,Ph.D., is an academic psychologist with a specialty in the measurement and prediction of human behavior. The communications provided are for informational purposes only and are not intended to be investment advice or recommendations for specific investment decisions. Dr. Kern is not a registered investment advisor, but is registered as a commodity trading advisor (CTA). The information provided is considered accurate, but cannot be guaranteed. Investments/trading in narrow market segments or gold futures is for individuals willing to accept a higher level of risk for the opportunity of greater returns. Past performance is no guarantee of future performance. His website is www.skigoldstocks.com.
Communications should be sent to: jeff@skigoldstocks.com.
Copyright © 2002-2024 Jeffrey Kern. All Rights Reserved.
321gold Ltd

| 