 Special SKI Report #268 Special SKI Report #268
Triple Buy's Close Sell-Stop Jeffrey M. Kern, Ph.D.
Email: jeff@skigoldstocks.com
USERX | historicals
Written Sunday Mar 27, 2022
Published Mar 28, 2022 Current USERX price = 13/06, Up another 31 cents (2.4%) since the last report 3 weeks ago. Introduction (repeated from prior Reports):
I have been using my unique SKI indices
to predict price changes in the precious metals' market for more
than two decades. And my indices continue to mark the critical
points. I have initiated a subscription website since 1/13/06
(yes, Friday the 13th) after having posted free updates for years
at www.321gold.com. SKI is a timing service; although
almost everyone seems to believe that market timing is impossible,
that IS what the SKI indices have done for 36 years.
The SKI indices contain short-term (16-20
trading days), intermediate-term (35-39 trading days), and long-term
(92-96 trading days) indices. A more comprehensive description
of these mathematical indices and their history is found here.
Basically, the indices compare today's price to prices from a
specified prior time period. The name of the index specifies the
time period (e.g., 92-96 index = compare today's price to prices
from 96, 95, 94, 93, and 92 trading days earlier). Although I
use the oldest gold mutual fund, USERX, for analyses, the predictions
are applicable to the broad precious metals' market. I do not
recommend or analyze specific stocks, but my subscribers from
around the world regularly discuss individual issues on our Forum.
In addition to the truly unique SKI indices, I also use "run
patterns" to guesstimate turning points in the precious metals'
market. A "run" refers to a pattern of daily up and
down market closing prices. If the market has 3 consecutive days
of higher closing prices, the run is "3 up". If prices
then decline for 2 consecutive days, the run becomes "3 up
and 2 down". If prices then close higher the next day, the
run changes to "2 down and 1 up". Some people have referred
to run patterns as "worms". A run pattern is only completed
after the direction of closing prices has changed. I have compiled
a listing of every run pattern that has ever occurred and generated
probabilities that the end of the run marks a high or a low, moderated
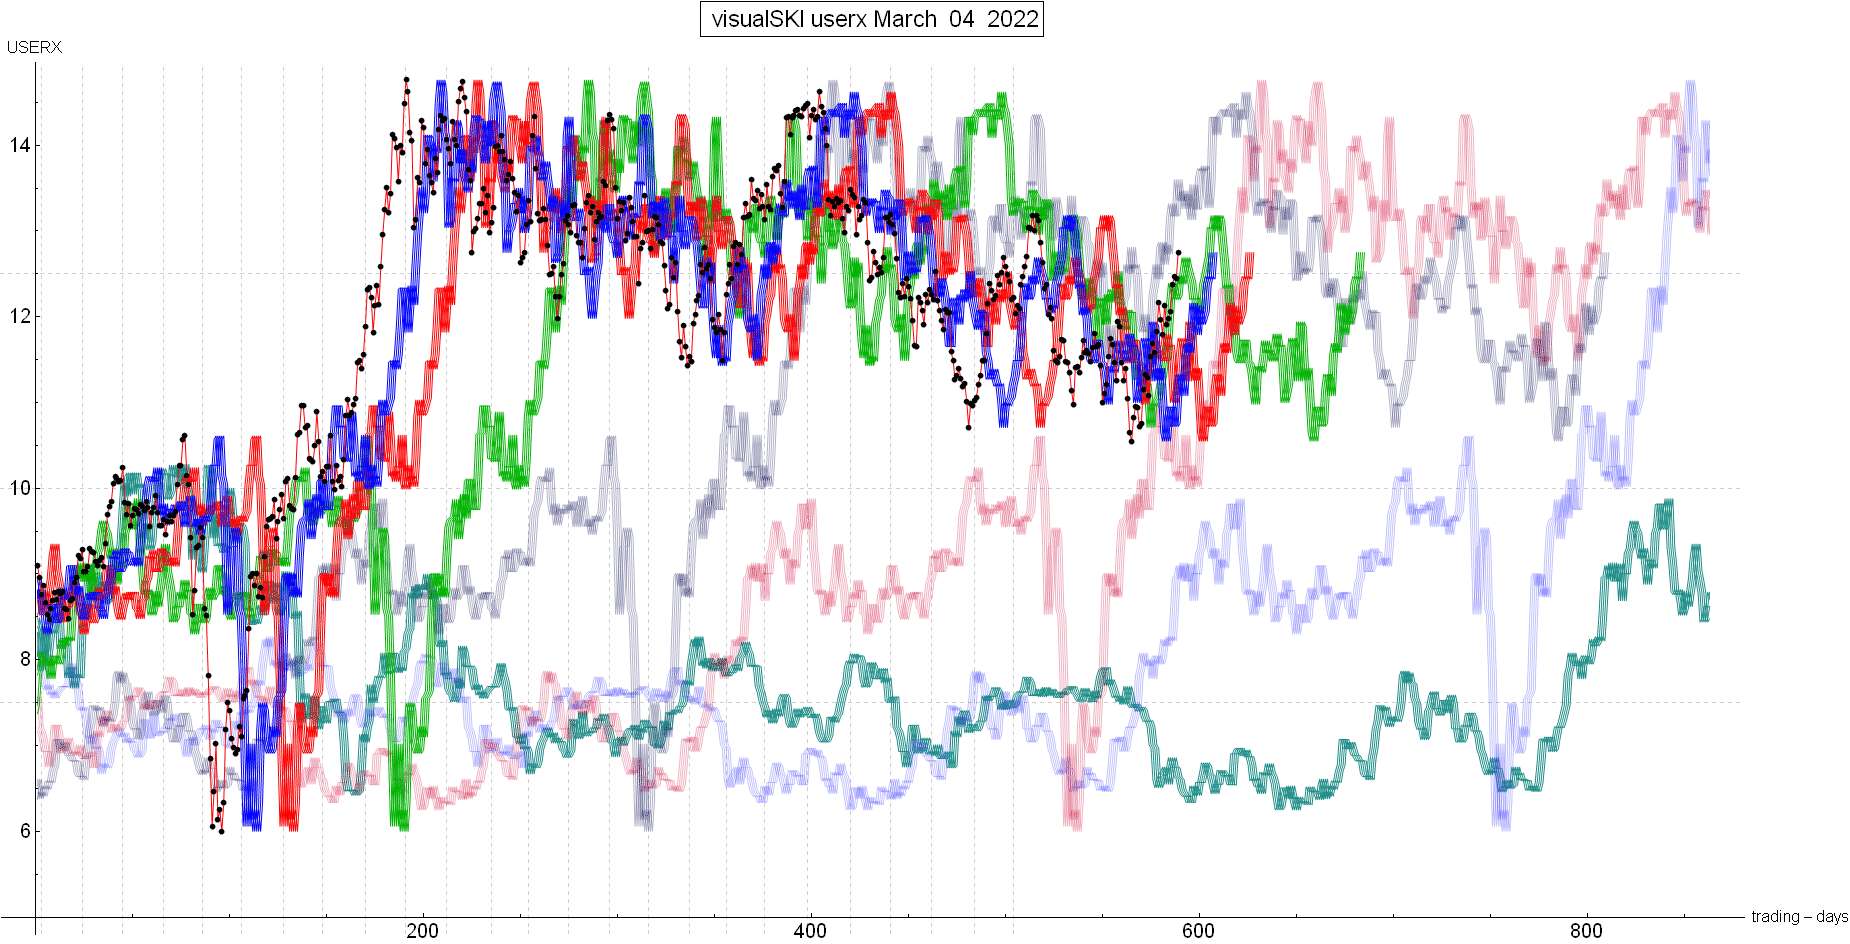
by the indices themselves. New Material The last SKI Report, written on 3/06/22, described how the bullish Triple Buy index pattern HAD generated on 2/10/22. The rising sell-stop had continued being avoided as USERX remained above the prices from 35-39 and 92-96 trading days earlier. The world-wide measure of the gold stocks (i.e., USERX, with its international holdings denominated in multiple currencies) had just kept “riding” the rising 92-96 index higher, as per the 3/06/22 visual presentation at that time (the black dots are the USERX price, and the green lines are the prices from 92-96 trading days earlier: see here. I tried to point out that the green index line would decline in the short-term, so a sideways-down period for a couple of weeks would be perfectly “feasible/possible”. Jeff, using the SKI indices, could not “predict” it. And, that sell-stop would rise to about USEX 13.18 during the next 3-4 weeks. We have now reached that time period.
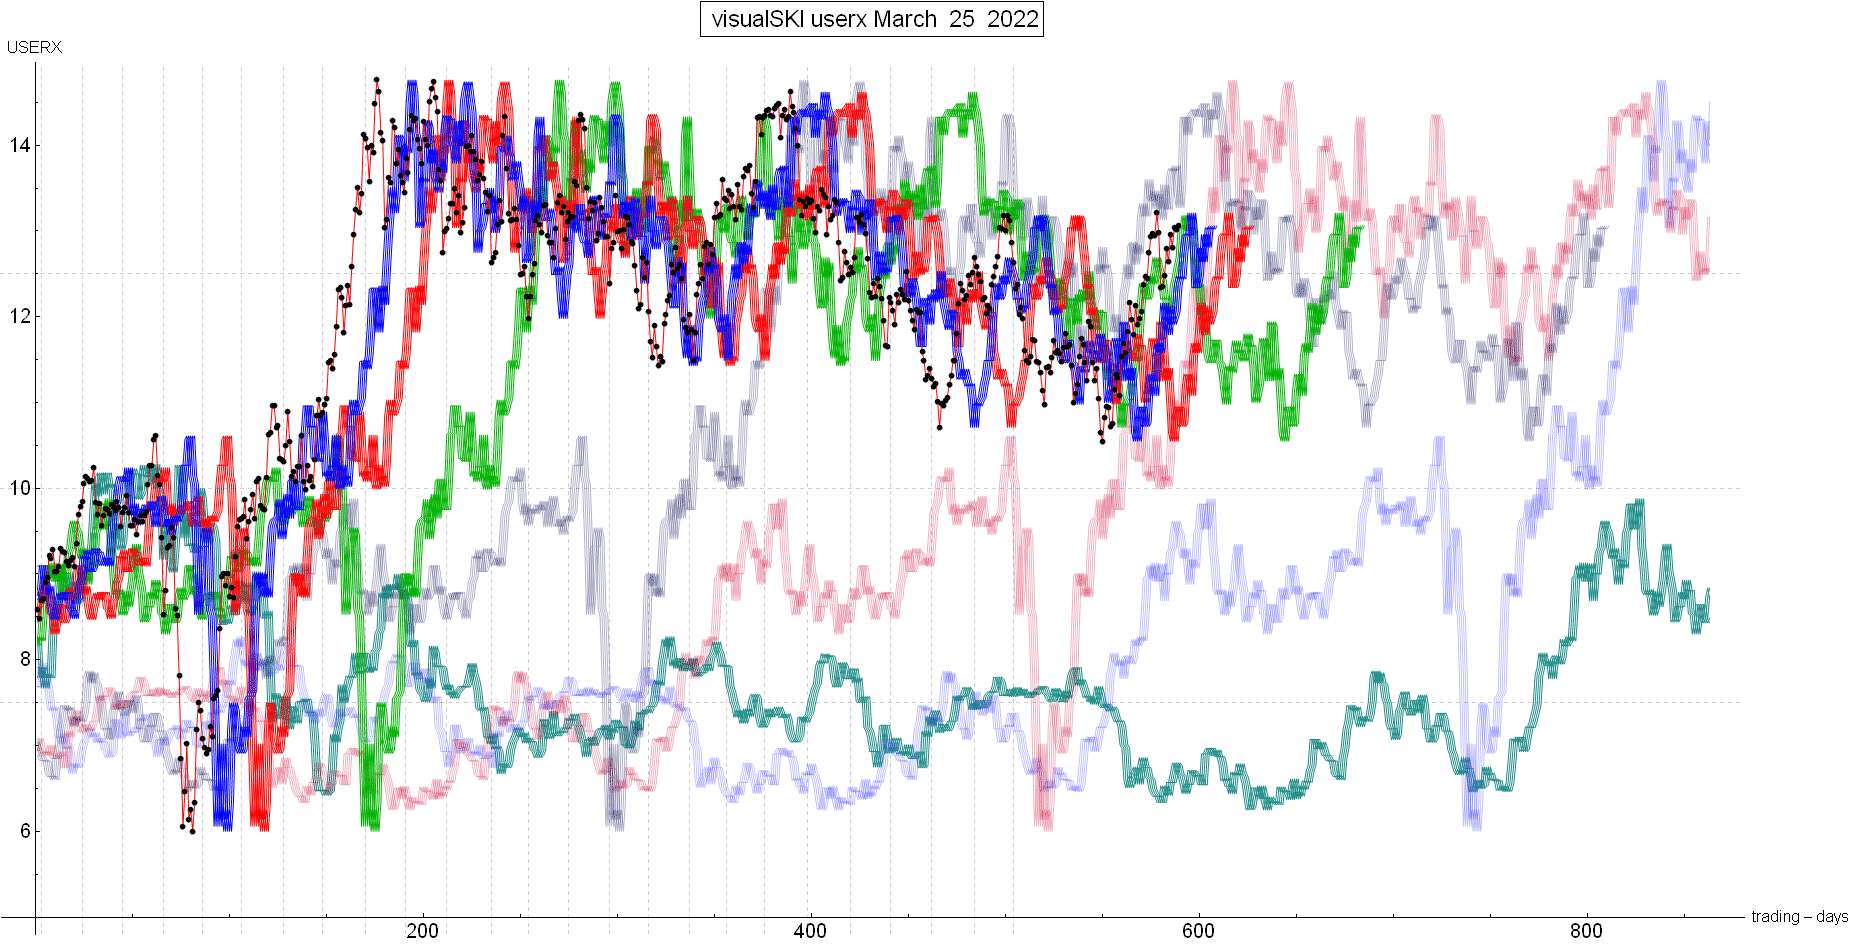
Since the 3/06/22 Update, gold quickly surged to test its all-time high around $2078 on 3/08/22 amidst extremely overbought sentiment. And it appeared to “fail” there. The HUI simultaneously rose to my next upside target around 327. That was the 2021 high on 5/17/2021 where Jeff had sold from a March buy. USERX (which only has closing prices) reached just above 13.18 level two days later (on 3/10/22) as the HUI made a new closing high at 315.91. Therefore, we reached the minimum expected price target well BEFORE the expected time period (that is NOW being reached). The USERX 13.18 minimum price target was based upon USERX’s high on 11/15/2021. After that 3/10/22 closing high for the gold stocks, they collapsed for 2 trading days. The decline went right down to the briefly declining 92-96 green index line. The index came within 1 day of generating its sell-stop sell signal. Jeff even started writing a special Intra-Week Sell Update, but I didn’t have to send it: USERX has kept rising, just barely enough to stay above the 92-96 index. Now, the USERX 13.18 price is about to enter the 92-96 index because it’s almost been 92-96 trading days from 11/15/22. Can you see the black-dot USERX price dropping down to the green index line? And then rising just enough to stay above the green line again and again? See here. I understand the description of the indices may seem “complicated”. That’s largely because it’s unique. I don’t know “how” or “why” the simple math reflects Nature (or cycles, or “something”) so closely since 1974 using a mutual fund that almost no one has cared much about for a few decades due to the multitude of products that have been introduced into the markets. Scientists develop reliable measurement procedures and then try to “explain” the phenomena they observe by developing theories. I just cannot explain “why”. All I “know” is that the green index’s sell-stop can/may activate if USERX drops below it during the next few trading days…. And, as I wrote 3 weeks ago, a great bull market also needs a rise above the 221 index’s faded purple line. If you look back at the current SKI chart, you can see that the 3/10/22 rise reached that index line and was rejected (again). That index line is far above and will also reach a topping area next week. I cannot rule out a spike higher in the gold stocks during this coming week, but the 92-96 index’s sell signal IS a safety (profit-taking) sell-stop. Best Wishes, Jeff If you are interested in following and learning more about the SKI indices, I'll write another Report in three weeks or you can shell out the big bucks for a SKI subscription. Weekly Updates are available by subscribing for a month (or longer if you're wise and cheap enough to want to save money) at my website www.skigoldstocks.com for the princely sum of $30 (for a one month subscription) or more ($240 for an annual subscription). I also provide more frequent intra-week daily messages/alerts at a slightly higher price along with access to our informative Forum. ###  SKI archives SKI archives
email: jeff@skigoldstocks.com
Jeffrey M. Kern,Ph.D., is an academic psychologist with a specialty in the measurement and prediction of human behavior. The communications provided are for informational purposes only and are not intended to be investment advice or recommendations for specific investment decisions. Dr. Kern is not a registered investment advisor, but is registered as a commodity trading advisor (CTA). The information provided is considered accurate, but cannot be guaranteed. Investments/trading in narrow market segments or gold futures is for individuals willing to accept a higher level of risk for the opportunity of greater returns. Past performance is no guarantee of future performance. His website is www.skigoldstocks.com.
Communications should be sent to: jeff@skigoldstocks.com.
Copyright © 2002-2024 Jeffrey Kern. All Rights Reserved.
321gold Ltd

|
