 Special SKI Report #267 Special SKI Report #267
Triple Buy Persists Jeffrey M. Kern, Ph.D.
Email: jeff@skigoldstocks.com
USERX | historicals
Written Sunday Mar 6, 2022
Published Mar 7, 2022 Current USERX price = 12.75, Up $1.21 (10.5%) since the last report 3 weeks ago. Introduction (repeated from prior Reports):
I have been using my unique SKI indices
to predict price changes in the precious metals' market for more
than two decades. And my indices continue to mark the critical
points. I have initiated a subscription website since 1/13/06
(yes, Friday the 13th) after having posted free updates for years
at www.321gold.com. SKI is a timing service; although
almost everyone seems to believe that market timing is impossible,
that IS what the SKI indices have done for 36 years.
The SKI indices contain short-term (16-20
trading days), intermediate-term (35-39 trading days), and long-term
(92-96 trading days) indices. A more comprehensive description
of these mathematical indices and their history is found here.
Basically, the indices compare today's price to prices from a
specified prior time period. The name of the index specifies the
time period (e.g., 92-96 index = compare today's price to prices
from 96, 95, 94, 93, and 92 trading days earlier). Although I
use the oldest gold mutual fund, USERX, for analyses, the predictions
are applicable to the broad precious metals' market. I do not
recommend or analyze specific stocks, but my subscribers from
around the world regularly discuss individual issues on our Forum.
In addition to the truly unique SKI indices, I also use "run
patterns" to guesstimate turning points in the precious metals'
market. A "run" refers to a pattern of daily up and
down market closing prices. If the market has 3 consecutive days
of higher closing prices, the run is "3 up". If prices
then decline for 2 consecutive days, the run becomes "3 up
and 2 down". If prices then close higher the next day, the
run changes to "2 down and 1 up". Some people have referred
to run patterns as "worms". A run pattern is only completed
after the direction of closing prices has changed. I have compiled
a listing of every run pattern that has ever occurred and generated
probabilities that the end of the run marks a high or a low, moderated
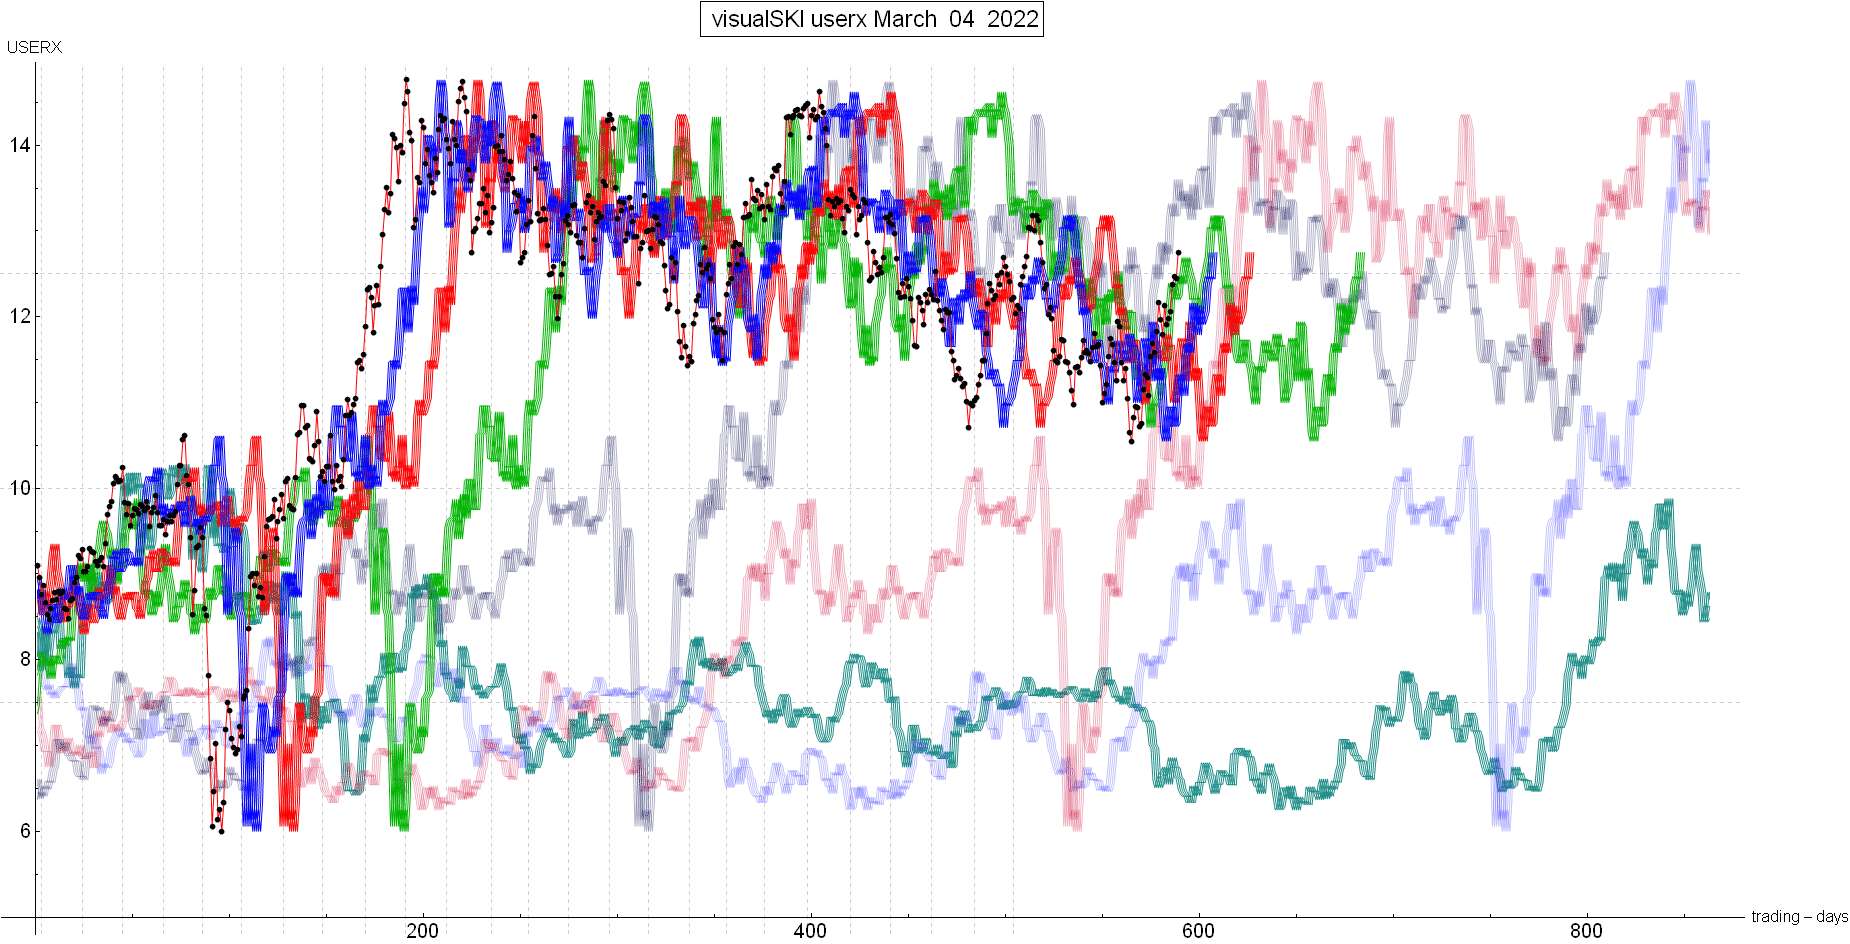
by the indices themselves. New Material The last SKI Report, written on 2/13/22, described how the prior Update HAD generated the rare bullish Triple Buy index pattern (i.e., a 16-20 index buy on 1/24/22, followed by 92-96 and 35-39 index buy signals). Jeff had sent the special Intra-Week Buy Update to SKIers on 2/10/22 to buy as USERX ended up closing down at 11.08. The prior and only such bullish Triple Buy (since 1974) had occurred in early December 2002. The potential caveat was that it was occurring with “War News” that had (in Jeff’s memory) always only lasted for a few hours or 1-2 trading days before gold gave back those “news-gains”. USERX still needed to rise to generate a first resistance 16-20 index sell signal in a few days and needed to avoid any brief meaningful decline that went below the prices from 35-39 trading days earlier. Gold and the gold stocks continued the expected rise. The needed 16-20 index sell signal generated on 2/17/22 as USERX rose to 12.16. It was supposed to be first resistance, but the gold stocks were then theoretically and historically supposed to rise through that resistance because this was the rather historic Triple Buy. The gold stocks went sideways for 6 trading days. The rising sell-stop kept being avoided as USERX remained above the prices from 35-39 and 92-96 trading days earlier. The out-break of the Russia-Ukraine War occurred into 2/24/22. It yielded the expected large spike higher in gold to $1970 and a 3% morning rise in the gold stocks PLUS the historically-typical instant reversal down back to $1880. BUT that sideways-down movement didn’t cause USERX to go below the 35-39 or 92-96 indices. It was “close” (as usual). The sell-stop 92-96 index came within 1 day of generating its sell-stop sell signal on 2/28/22 (last Monday). The gold stocks needed to rise on 3/01/22 and keep rising. And that rise occurred. Don’t ask “how or why” the indices are able to reflect Nature like that, but that IS how SKI has functioned for 37 years. The world-wide measure of the gold stocks (i.e., USERX, with its international holdings denominated in multiple currencies) has just kept “riding” the rising 92-96 index higher. Look at the visual representation of USERX relative to the SKI indices: here. You should be able to see how USERX DID make a “wash-out” low 5 weeks ago at a new 1.5 year low of 10.55, then went above the green line 92-96 index and the red line 35-39 index (for the Triple Buy), then above the blue line 16-20 index for first resistance, AND THEN HAS KEPT RISING JUST ENOUGH TO STAY ABOVE (“RIDE”) THE MASTER 92-96 INDEX HIGHER. Therefore, the rising objective sell-stop has continued to be avoided. For at least 90 years, technicians have “bragged” that “market technicals” come BEFORE the “news”. This has been another excellent example. SKIers could see the POSSIBILITY of a Triple Buy 1-2 months BEFORE the “war news”. Jeff did NOT “know” if the Triple Buy would occur until it did so. As I’ve written so many times, one should not use the U.S. Dollar index (UUP) as a predictor for gold because it is flawed via over-weighting the importance of the Euro. For example, the January 2016 bull market 100-150% rise in the gold stocks was accompanied by a RISING U.S. Dollar index. Just use USERX. That U.S. Dollar index has once again been rising along with gold and the gold stocks. Now, look back at that SKI index chart’s green line 92-96 index. The gold stocks ARE short-term “overbought” BUT USERX simply needs to remain above that green index line from 5-months earlier. That index line declines in the short-term, so a sideways-down period for a couple of weeks is perfectly “feasible/possible”. After being in cash for a long 6 months, SKI gave its buy signals with a rising sell-stop. We use that sell-stop that will rise to about USEX 13.18 during the next 3-4 weeks. That’s not a big rise, but all Jeff knows is to remain long until/unless the sell-stop generates. Over perhaps several months, the gold stocks are highly likely to eventually correct back down to below the prices from 16-20 trading days and 35-39 trading days earlier. Jeff canNOT yet predict how high the current rise will go OR when such a decline will begin but it ALWAYS occurs. You should easily be able to see how that green index line will decline over time. The BIGGER technical factor will still involve the faded purple 221 index line that just keeps rising for months to the May-June 2021 high of USERX 14.72 (4-cents below the Summer 2020 high of 14.76; Jeffski did exit a March 2021 buy in mid-May to early June 2021). The 221 index is the final index line that is above the current (black dot) price. When will that index re-buy? It last bought off the virus plunge on March 27, 2020 at USERX 7.08 and sold on June 27, 2021 at USERX 13.34. The index signals are purely mathematical and are rather exact to within 0-2 trading days… Best Wishes, Jeff If you are interested in following and learning more about the SKI indices, I'll write another Report in three weeks or you can shell out the big bucks for a SKI subscription. Weekly Updates are available by subscribing for a month (or longer if you're wise and cheap enough to want to save money) at my website www.skigoldstocks.com for the princely sum of $30 (for a one month subscription) or more ($240 for an annual subscription). I also provide more frequent intra-week daily messages/alerts at a slightly higher price along with access to our informative Forum. ###  SKI archives SKI archives
email: jeff@skigoldstocks.com
Jeffrey M. Kern,Ph.D., is an academic psychologist with a specialty in the measurement and prediction of human behavior. The communications provided are for informational purposes only and are not intended to be investment advice or recommendations for specific investment decisions. Dr. Kern is not a registered investment advisor, but is registered as a commodity trading advisor (CTA). The information provided is considered accurate, but cannot be guaranteed. Investments/trading in narrow market segments or gold futures is for individuals willing to accept a higher level of risk for the opportunity of greater returns. Past performance is no guarantee of future performance. His website is www.skigoldstocks.com.
Communications should be sent to: jeff@skigoldstocks.com.
Copyright © 2002-2024 Jeffrey Kern. All Rights Reserved.
321gold Ltd

| 