 Special SKI Report #167 Special SKI Report #167
Gold Stock Update: Correction Time? Jeffrey M. Kern, Ph.D.
Email: jeff@skigoldstocks.com
USERX | historicals
Written Sunday Mar 27, 2016
Published Mar 28, 2016 Current USERX price = 6.57, Down 15 cents (2.2%) since the last report 3 weeks ago. Introduction (repeated from prior Reports):
I have been using my unique SKI indices
to predict price changes in the precious metals' market for more
than two decades. And my indices continue to mark the critical
points. I have initiated a subscription website since 1/13/06
(yes, Friday the 13th) after having posted free updates for years
at www.321gold.com. SKI is a timing service; although
almost everyone seems to believe that market timing is impossible,
that IS what the SKI indices have done for 36 years.
The SKI indices contain short-term (16-20
trading days), intermediate-term (35-39 trading days), and long-term
(92-96 trading days) indices. A more comprehensive description
of these mathematical indices and their history is found here.
Basically, the indices compare today's price to prices from a
specified prior time period. The name of the index specifies the
time period (e.g., 92-96 index = compare today's price to prices
from 96, 95, 94, 93, and 92 trading days earlier). Although I
use the oldest gold mutual fund, USERX, for analyses, the predictions
are applicable to the broad precious metals' market. I do not
recommend or analyze specific stocks, but my subscribers from
around the world regularly discuss individual issues on our Forum.
In addition to the truly unique SKI indices, I also use "run
patterns" to guesstimate turning points in the precious metals'
market. A "run" refers to a pattern of daily up and
down market closing prices. If the market has 3 consecutive days
of higher closing prices, the run is "3 up". If prices
then decline for 2 consecutive days, the run becomes "3 up
and 2 down". If prices then close higher the next day, the
run changes to "2 down and 1 up". Some people have referred
to run patterns as "worms". A run pattern is only completed
after the direction of closing prices has changed. I have compiled
a listing of every run pattern that has ever occurred and generated
probabilities that the end of the run marks a high or a low, moderated
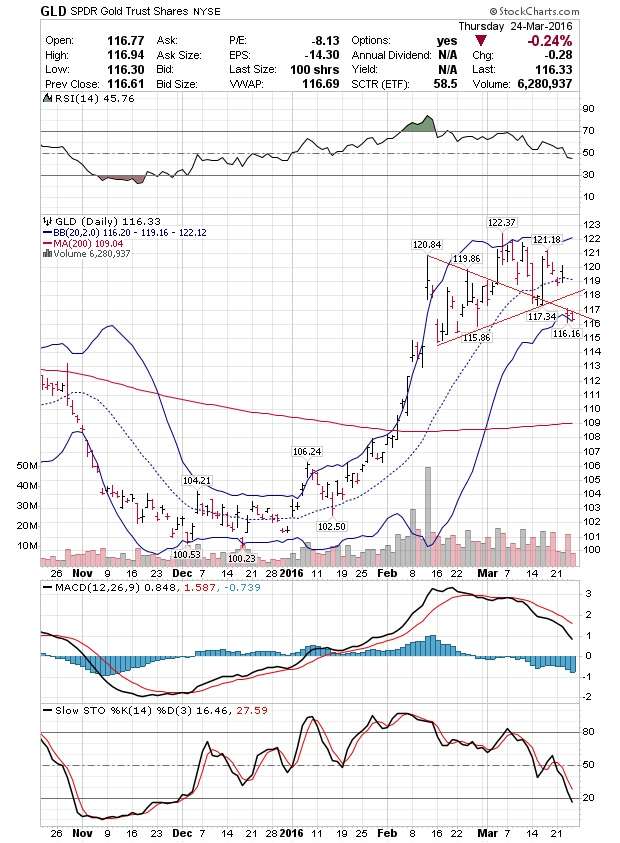
by the indices themselves. New Material The last gold stock SKI Report, written on Sunday 3/06/16, expected one more short-term rise. The Report noted that the SKI indices usually do not mark intermediate-term highs during bull markets, but that the long-term SKI indices were set up where they might mark such a high before a correction back down to the 16-20 and 35-39 indices. The Report concluded that an unexpected 442 index sell signal might be useful as a sell-stop and that a break below the recent gold (GLD) pennant/triangle would appear to be bearish. As of 3 weeks ago, the gold stocks (USERX and the HUI) remained on their rather perfect 92-96 and 35-39 index buy signals from 1/25/16-1/29/16. The long-term system had begun to yield the same super-bullish index pattern: The USERX 221 index (the equivalent of the 92-96 index) had bought on 2/08/16 and the 442 index (the equivalent of the 35-39 index) had also bought. The remaining piece of the puzzle was the 663 resistance index that sells on rises (the equivalent of the 16-20 index). USERX needed to rise over that 663 index and to avoid falling below the 442 index to continue the immediate bullish case (as per the SKI chart that was included in the prior Report; Legend: blue: 16-20 index, red: 35-39 index, green: 92-96 index faded purple: 221 index, faded red: 442 index, faded blue: 663 index, turquoise: 884 index). What happened? The gold stocks rose on the day after that last Report with USERX rising 3% to 6.93. That rise finally hit/touched the 663 index resistance. The ensuing decline into 3/15/16 at USERX 6.68 was just enough to generate the UNwanted 442 index sell signal and Jeff sent the Intra-Week Sell Update. The 442 index had marked the 3/16/16 U.S. Federal Reserve announcement as an important technical day (i.e., index signals EXECUTE one day after they GENERATE). The 442 index sell signal was likely to be bearish, but a 5% rise to a new 2016 high on 3/16/16 would instantly generate a 442 index buy signal that would negate the sell signal. As you might remember, gold and the gold stocks then surged higher on 3/16/16 after the U.S. Federal Reserve announcement. The HUI and GDX rose 6-8%! It appeared that USERX was going to rise the 5% needed to maintain the bullish 442 index buy signal pattern by instantly generating a new 442 index buy signal. But USERX surprisingly rose only 3% to 6.89, failed to follow the HUI/GDX to a new 2016 high, and the 442 index sell signal executed without a new 442 index buy signal. The gold stocks then declined a little before USERX rose last Tuesday (3/22/16) back to 6.89 (the price where the 442 index had executed its 3/16/16 sell signal). And the 663 resistance index was hit/touched again because its back prices (from 3 years ago!) added in new low back prices of 6.68 and 6.69. It was “interesting” that the prior decline into 3/15/16 had taken USERX down to 6.68 and now the 663 resistance index was being hit/touched because it had added in that 6.68. Hence, a break below USERX 6.68 would look quite bearish because the 663 index resistance would have stopped the rise and USERX would make a lower low. Last Wednesday’s (3/23/16) harsh decline immediately took USERX below 6.68 (down to 6.60) and gold (GLD) gapped below its prior triangular support: see/click here. Conclusion The regular SKI indices (the 92-96, 35-39, and 16-20 indices) remain on their strongly bullish (rare) buy signals from late January 2016 and should remain on such buy signals for an extended time period. But the long-term indices have apparently stopped the rise via a hit/touch of the 663 resistance index and a 442 index sell signal. The very long-term SKI indices have failed to yield their super-bullish index pattern. Last week’s decline strongly suggests that a decline has begun. The gold stocks are now likely to decline to the supportive 16-20 and 35-39 indices over several weeks where I will be looking to buy. I don’t enjoy doing this, but the updated SKI charts and the indices’ back prices will be reserved for subscribers. You can look back 16-20 and 35-39 trading days to obtain the indices’ prices for USERX and the HUI. I will add the following information: The HUI finally got over its 221 index last week but is likely to generate the normal (bearish) quick sell signal tomorrow (3/28/16) if/when the HUI closes below 178.83. Best Wishes, Jeff If you are interested in following and learning more about the SKI indices, I'll write another Report in three weeks or you can shell out the big bucks for a SKI subscription. Weekly Updates are available by subscribing for a month (or longer if you're wise and cheap enough to want to save money) at my website www.skigoldstocks.com for the princely sum of $25 (for a one month subscription) or more ($200 for an annual subscription). I also provide more frequent intra-week messages/alerts at a slightly higher price along with access to our informative Forum and a managed gold futures program. The precious metals are in a very long-term (decade+) up-trend but are the most precarious, volatile, and psychologically difficult market in the world (in my opinion). That's the way it's always been. ###  SKI archives SKI archives
email: jeff@skigoldstocks.com
Jeffrey M. Kern,Ph.D., is an academic psychologist with a specialty in the measurement and prediction of human behavior. The communications provided are for informational purposes only and are not intended to be investment advice or recommendations for specific investment decisions. Dr. Kern is not a registered investment advisor, but is registered as a commodity trading advisor (CTA). The information provided is considered accurate, but cannot be guaranteed. Investments/trading in narrow market segments or gold futures is for individuals willing to accept a higher level of risk for the opportunity of greater returns. Past performance is no guarantee of future performance. His website is www.skigoldstocks.com.
Communications should be sent to: jeff@skigoldstocks.com.
Copyright © 2002-2024 Jeffrey Kern. All Rights Reserved. 321gold Ltd

| 