 Special SKI Report #285 Special SKI Report #285
Gold Stock Update: Bull Market Maintains Jeffrey M. Kern, Ph.D.
Email: jeff@skigoldstocks.com
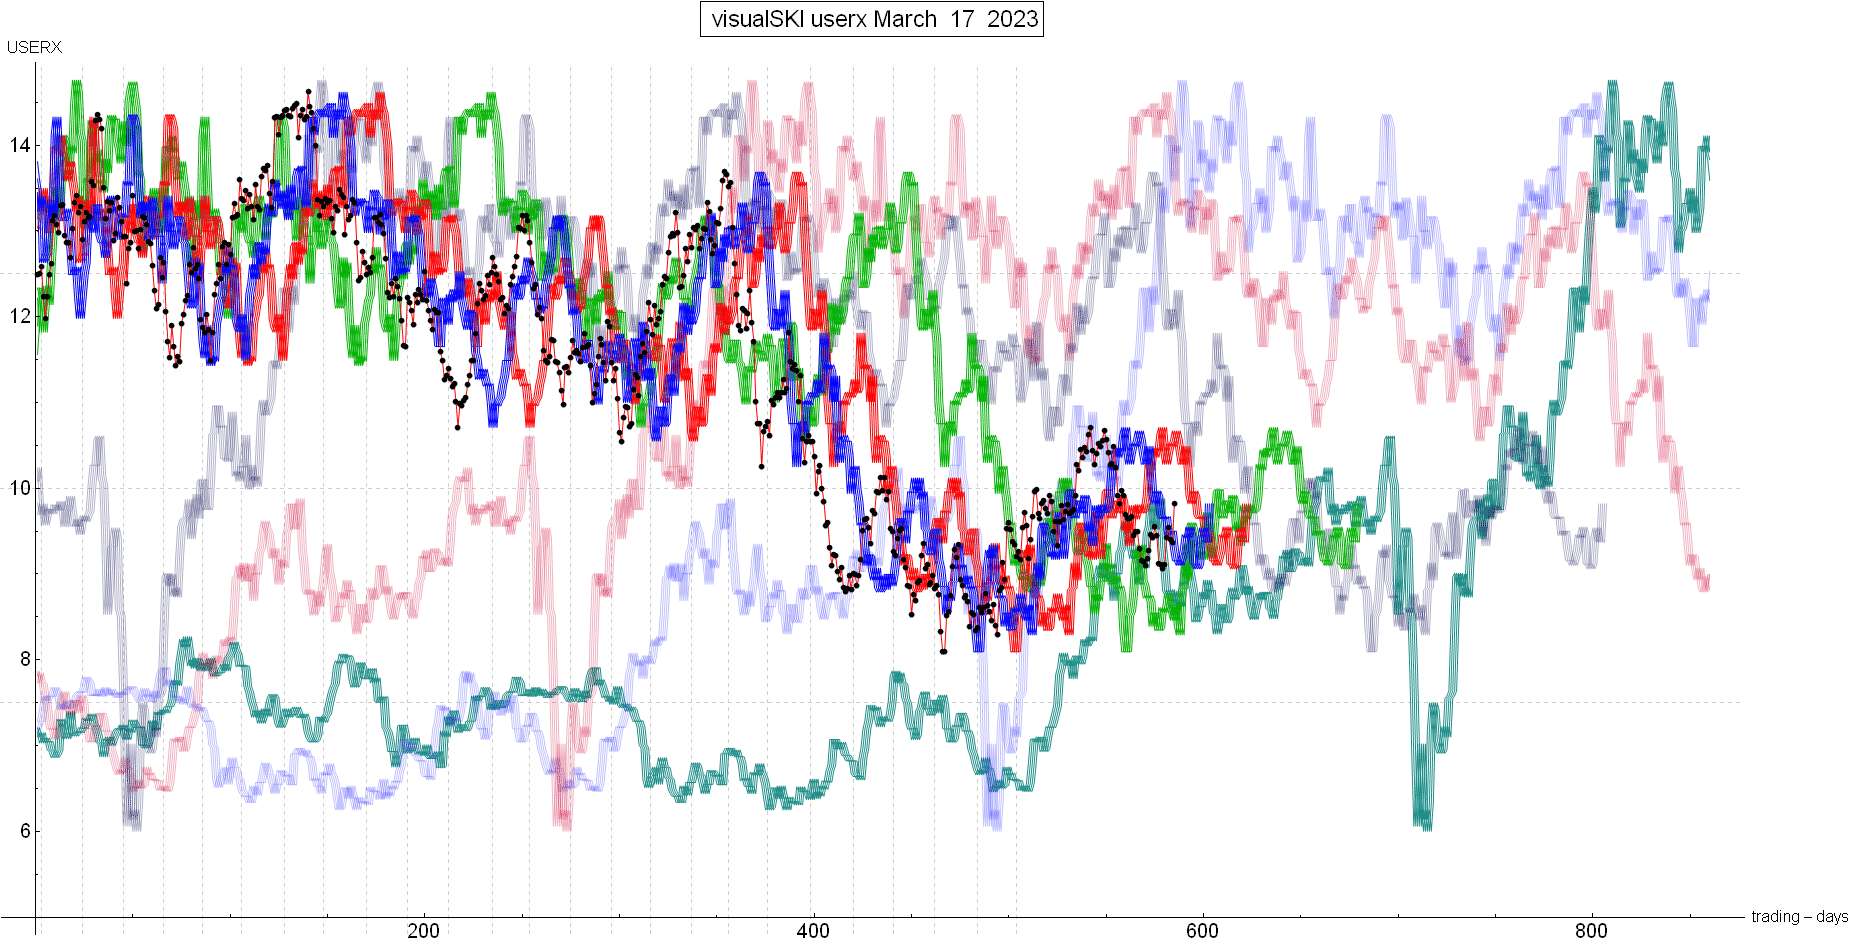
USERX | historicals
Written Sunday Mar 19, 2023
Published Mar 20, 2023 Current USERX price = 9.82, Up 72 cents (7.9%) since the last report 3 weeks ago. Introduction (repeated from prior Reports):
I have been using my unique SKI indices
to predict price changes in the precious metals' market for more
than two decades. And my indices continue to mark the critical
points. I have initiated a subscription website since 1/13/06
(yes, Friday the 13th) after having posted free updates for years
at www.321gold.com. SKI is a timing service; although
almost everyone seems to believe that market timing is impossible,
that IS what the SKI indices have done for 36 years.
The SKI indices contain short-term (16-20
trading days), intermediate-term (35-39 trading days), and long-term
(92-96 trading days) indices. A more comprehensive description
of these mathematical indices and their history is found here.
Basically, the indices compare today's price to prices from a
specified prior time period. The name of the index specifies the
time period (e.g., 92-96 index = compare today's price to prices
from 96, 95, 94, 93, and 92 trading days earlier). Although I
use the oldest gold mutual fund, USERX, for analyses, the predictions
are applicable to the broad precious metals' market. I do not
recommend or analyze specific stocks, but my subscribers from
around the world regularly discuss individual issues on our Forum.
In addition to the truly unique SKI indices, I also use "run
patterns" to guesstimate turning points in the precious metals'
market. A "run" refers to a pattern of daily up and
down market closing prices. If the market has 3 consecutive days
of higher closing prices, the run is "3 up". If prices
then decline for 2 consecutive days, the run becomes "3 up
and 2 down". If prices then close higher the next day, the
run changes to "2 down and 1 up". Some people have referred
to run patterns as "worms". A run pattern is only completed
after the direction of closing prices has changed. I have compiled
a listing of every run pattern that has ever occurred and generated
probabilities that the end of the run marks a high or a low, moderated
by the indices themselves. New Material
The last SKI Report, written on 2/26/23, described how the continuing February decline (from the 1/13/23 663 index’s sell signal at USERX 10.71) had NOT yet been large enough to stop-out Mechanical SKI’s 92-96 index bull market buy signal. But the decline HAD been large enough to almost reach the next support (as USERX had fallen to 9.10) to generate a supportive 884 index buy signal. The 884 index is a rare contrarian index that buys on declines and sells on rises (like the 663 index and the 16-20 index). It compares the current price to the prices from 880-885 trading days earlier. Those are the prices from almost 4 years ago. The 884 index did quickly generate its buy signal and there was the brief rise during the week immediately after that last SKI Report. The rise, back to USERX 9.55 on 3/03/23, began to move the 884 index towards a quick sell signal. And the HUI had risen for an extended 5 consecutive days. Therefore, the gold stocks were expected to decline again. The important issue was whether that decline would continue to avoid generating the master 92-96 index’s sell signal. The next week’s decline to below USERX 9.10 was quite “worrisome”, but the gold stocks held at USERX 9.06 on 3/09/23. The 92-96 index’s back prices were down at 8.77-8.46, so that index did not sell. And then the rise commenced. The rise quickly generated the 884 index’s sell signal. That sell signal IS initial resistance and needs to be overcome. The last time that the 884 index bought was near the March 2020 COVID-crash low and then it quickly sold. But the gold stocks rose through that sell signal and initiated the last gold bull market. THEREFORE, THE CURRENT 884 INDEX PATTERN IS THE SAME PATTERN THAT INITIATED AT THE 2020 GOLD STOCK BULL MARKET. The above paragraphs’ written description is portrayed in this weekend’s USERX chart. The black dots are the current USERX price. Can you see how USERX declined to hit/touch the green line 92-96 index and to just below the turquoise 884 index line for the 884 index’s buy signal? The gold stocks then rebounded to the turquoise index line, declined again, and then surged above the turquoise line and the 16-20 index’s blue index line. The contrarian 16-20 index is about to sell, but just like the 884 index, a bull market needs to rise through that resistance. In conclusion, the Mechanical SKI potential bull market remains intact for a potentially very large rise. The next objective index buy-point is if/when USERX rises over the DECLINING red line (the intermediate-term 35-39 index) in the above SKI-chart. The all-important sell-stop continues to be a decline to below 92-96 index’s green chart line. That green line is still too far below to generate the sell-stop. But the 92-96 index will rise in a couple of weeks. As always, it’s not just a matter of Price. The market’s behavior is a function of the interaction between Price AND Time. Banking crises, wars, U.S. Federal Reserve actions, inflation, etc., will be reflected by the market’s Price X Time behavior. Best wishes, Jeff If you are interested in following and learning more about the SKI indices, I'll write another Report in three weeks or you can shell out the big bucks for a SKI subscription. Weekly Updates are available by subscribing for a month (or longer if you're wise and cheap enough to want to save money) at my website www.skigoldstocks.com for the princely sum of $30 (for a one month subscription) or more ($240 for an annual subscription). I also provide more frequent intra-week daily messages/alerts at a slightly higher price along with access to our informative Forum. ###  SKI archives SKI archives
email: jeff@skigoldstocks.com
Jeffrey M. Kern,Ph.D., is an academic psychologist with a specialty in the measurement and prediction of human behavior. The communications provided are for informational purposes only and are not intended to be investment advice or recommendations for specific investment decisions. Dr. Kern is not a registered investment advisor, but is registered as a commodity trading advisor (CTA). The information provided is considered accurate, but cannot be guaranteed. Investments/trading in narrow market segments or gold futures is for individuals willing to accept a higher level of risk for the opportunity of greater returns. Past performance is no guarantee of future performance. His website is www.skigoldstocks.com.
Communications should be sent to: jeff@skigoldstocks.com.
Copyright © 2002-2024 Jeffrey Kern. All Rights Reserved.
321gold Ltd

| 