 Special SKI Report #284 Special SKI Report #284
Gold Stock Update Jeffrey M. Kern, Ph.D.
Email: jeff@skigoldstocks.com
USERX | historicals
Written Sunday Feb 26, 2023
Published Feb 27, 2023 Current USERX price = 9.10, Down another 81 cents (8.2%) since the last report 3 weeks ago. Introduction (repeated from prior Reports):
I have been using my unique SKI indices
to predict price changes in the precious metals' market for more
than two decades. And my indices continue to mark the critical
points. I have initiated a subscription website since 1/13/06
(yes, Friday the 13th) after having posted free updates for years
at www.321gold.com. SKI is a timing service; although
almost everyone seems to believe that market timing is impossible,
that IS what the SKI indices have done for 36 years.
The SKI indices contain short-term (16-20
trading days), intermediate-term (35-39 trading days), and long-term
(92-96 trading days) indices. A more comprehensive description
of these mathematical indices and their history is found here.
Basically, the indices compare today's price to prices from a
specified prior time period. The name of the index specifies the
time period (e.g., 92-96 index = compare today's price to prices
from 96, 95, 94, 93, and 92 trading days earlier). Although I
use the oldest gold mutual fund, USERX, for analyses, the predictions
are applicable to the broad precious metals' market. I do not
recommend or analyze specific stocks, but my subscribers from
around the world regularly discuss individual issues on our Forum.
In addition to the truly unique SKI indices, I also use "run
patterns" to guesstimate turning points in the precious metals'
market. A "run" refers to a pattern of daily up and
down market closing prices. If the market has 3 consecutive days
of higher closing prices, the run is "3 up". If prices
then decline for 2 consecutive days, the run becomes "3 up
and 2 down". If prices then close higher the next day, the
run changes to "2 down and 1 up". Some people have referred
to run patterns as "worms". A run pattern is only completed
after the direction of closing prices has changed. I have compiled
a listing of every run pattern that has ever occurred and generated
probabilities that the end of the run marks a high or a low, moderated
by the indices themselves. New Material
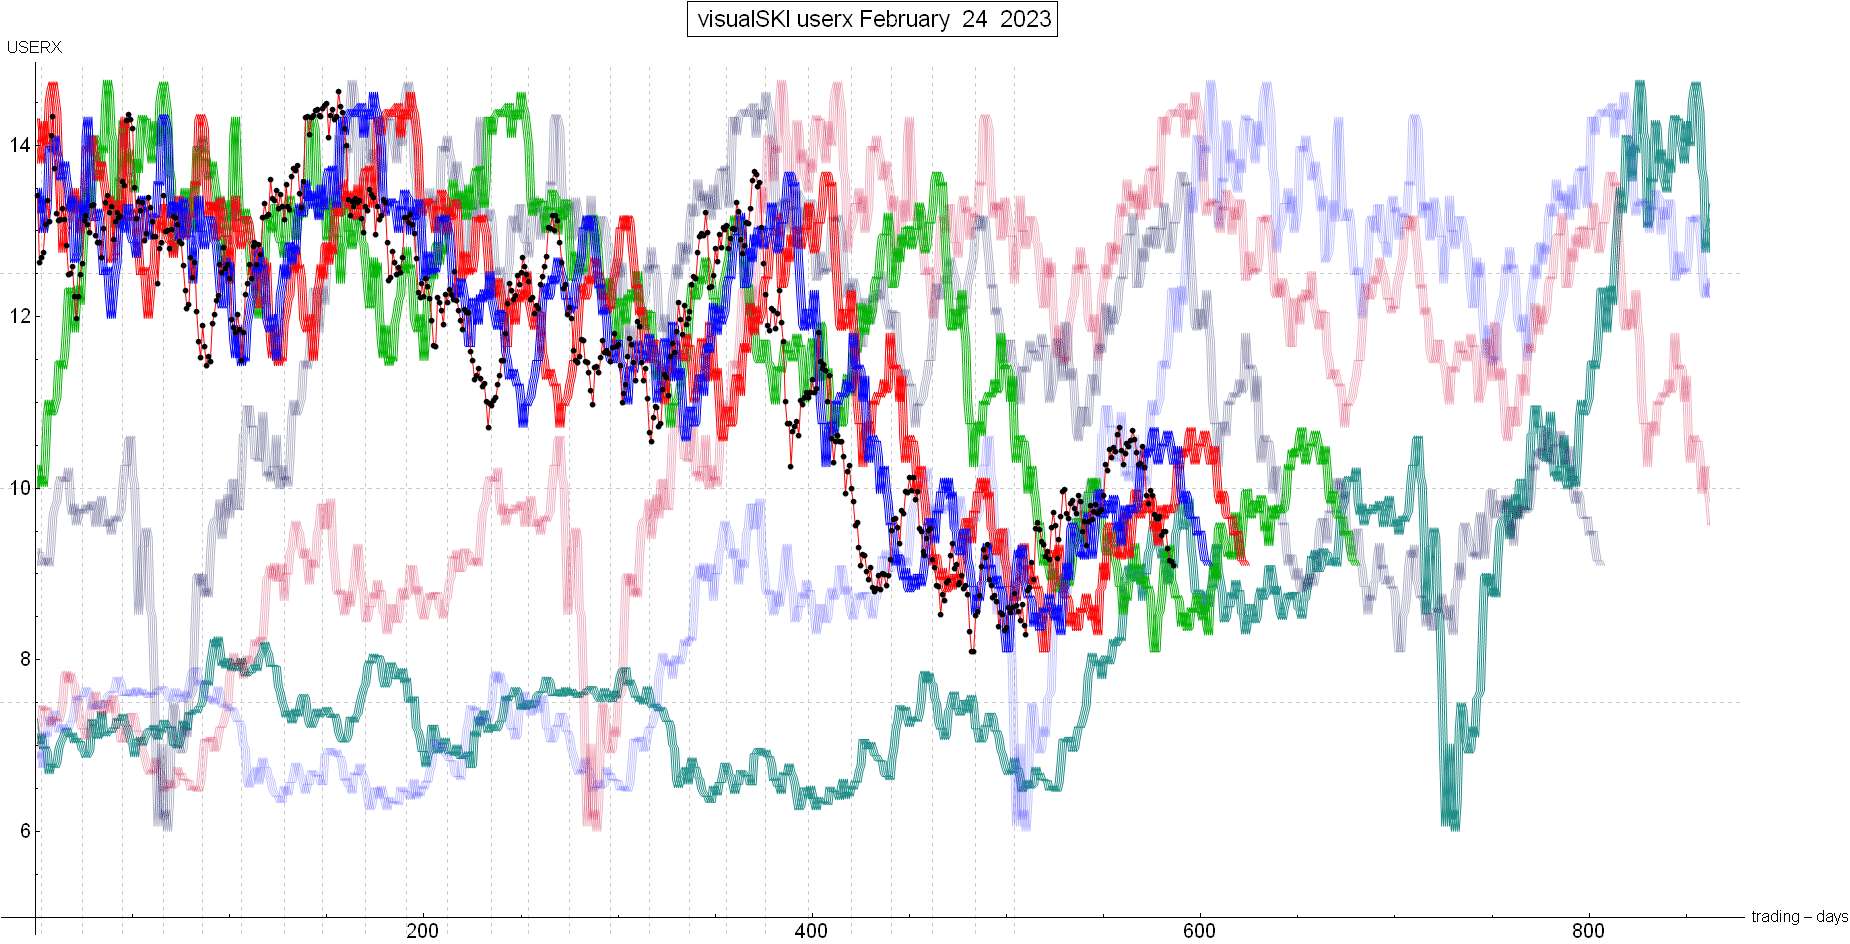
The last SKI Report, written on 2/05/23, continued to describe how the gold stocks had topped on 1/13/23 via a 663 index sell signal at USERX 10.71 while Mechanical SKI remained on a potential longer-term bull market. That 664 index sells on rises and buys on declines. Gold and various gold stock measures had made higher highs after 1/13/23. But as usual (not “always”, so I also follow the SKI-HUI), those measures were/are NOT as valid as USERX. That mutual fund includes gold stock movements from across the world and the major commodity currencies (i.e., the Canadian and Australian Dollars). It’s been USERX (since 1974) and no matter how many times I’ve stated this (e.g., don’t’ follow the U.S. Dollar index per se; follow those commodity currencies), no one seems to care. That’s been the case since I’ve publicly posted since 1/02/2000. Anyway, the last public Update wasn’t definitive: USERX was about to generate a new supportive 663 index buy signal (on a decline). And this would be a “do-or-die” situation. That’s quite a statement and I’m not prone to such hyperbole. That conclusion was DEFICIENT because it could not include a TIME-FRAME for a decline IF the approaching 663 index’s buy signal FAILED to mark a low. Jeff could not specify a time frame because the index patterns were “new/novel” (since 1974). Therefore, the title and conclusion of that Report was that the gold stocks were about to decline into a supportive 663 index buy signal that “had better” mark a low. And then the decline simply “continued”. SKI’s (rare) 663 index AND common 16-20 index yielded immediate buy signals in the 1-2 days after that last Report (as expectd) but were quickly broken-to-the-downside on 2/09/23. After the break-down of those buy signals, the HUI has dropped for an extraordinary 12 consecutive days. Guess What? The decline has not yet been large enough to stop-out Mechanical SKI’s 92-96 index bull market. In fact, if you look back 92-96 trading days, the past week’s decline hit/touched those back prices. The index has NOT (as yet) sold. And USERX’s decline is close to hitting the next (rare) level of support: A supportive 884 index buy signal. Here’s the USERX chart with the current price as the black dots, the 92-96 index being the green line, and the 884 index being the turquoise index line. See how the gold stocks have smashed down to reach the green line and have almost gone below the turquoise 884 index line? Note that the master green 92-96 index is continuing to decline towards the 11/03/2022 low of USERX 8.29. In conclusion, the gold stocks have plunged down to almost reach the 884 index’s supportive Price X Time level, while the longer-term Mechanical SKI’s potential bull market still has not been negated. Once again, this next support level “had better hold” and this time Jeff will conclude that it’s more likely than last time that it WILL hold. The bullish case needs to at least use up some weeks of time, do some short-term rise, and most importantly avoid declining to a 92-96 index sell signal. The SKI-bearish scenario, based upon the master 92-96 index, is that the gold stocks would decline to below the 11/03/2022 low at below USERX 8.29 to generate a 92-96 index sell signal. Jeff does not “advertise” beyond these postings. There’s no social media. I do this with integrity, consistency for 20+ public years, and objective SKI-index signals that DO mark most technical spots. Be consistent and conservative using truly time-tested valid information. Subscribers receive more detailed, specific, and comprehensive daily and/or weekly Updates. Best wishes, Jeff If you are interested in following and learning more about the SKI indices, I'll write another Report in three weeks or you can shell out the big bucks for a SKI subscription. Weekly Updates are available by subscribing for a month (or longer if you're wise and cheap enough to want to save money) at my website www.skigoldstocks.com for the princely sum of $30 (for a one month subscription) or more ($240 for an annual subscription). I also provide more frequent intra-week daily messages/alerts at a slightly higher price along with access to our informative Forum. ###  SKI archives SKI archives
email: jeff@skigoldstocks.com
Jeffrey M. Kern,Ph.D., is an academic psychologist with a specialty in the measurement and prediction of human behavior. The communications provided are for informational purposes only and are not intended to be investment advice or recommendations for specific investment decisions. Dr. Kern is not a registered investment advisor, but is registered as a commodity trading advisor (CTA). The information provided is considered accurate, but cannot be guaranteed. Investments/trading in narrow market segments or gold futures is for individuals willing to accept a higher level of risk for the opportunity of greater returns. Past performance is no guarantee of future performance. His website is www.skigoldstocks.com.
Communications should be sent to: jeff@skigoldstocks.com.
Copyright © 2002-2024 Jeffrey Kern. All Rights Reserved.
321gold Ltd

|
