 Special SKI Report #266 Special SKI Report #266
Signals Marking Friday-Monday Jeffrey M. Kern, Ph.D.
Email: jeff@skigoldstocks.com
USERX | historicals
Written Sunday Feb 13, 2022
Published Feb 14, 2022 Current USERX price = 11.54, Up 8 cents (0.7%) since the last report 3 weeks ago. Introduction (repeated from prior Reports):
I have been using my unique SKI indices
to predict price changes in the precious metals' market for more
than two decades. And my indices continue to mark the critical
points. I have initiated a subscription website since 1/13/06
(yes, Friday the 13th) after having posted free updates for years
at www.321gold.com. SKI is a timing service; although
almost everyone seems to believe that market timing is impossible,
that IS what the SKI indices have done for 36 years.
The SKI indices contain short-term (16-20
trading days), intermediate-term (35-39 trading days), and long-term
(92-96 trading days) indices. A more comprehensive description
of these mathematical indices and their history is found here.
Basically, the indices compare today's price to prices from a
specified prior time period. The name of the index specifies the
time period (e.g., 92-96 index = compare today's price to prices
from 96, 95, 94, 93, and 92 trading days earlier). Although I
use the oldest gold mutual fund, USERX, for analyses, the predictions
are applicable to the broad precious metals' market. I do not
recommend or analyze specific stocks, but my subscribers from
around the world regularly discuss individual issues on our Forum.
In addition to the truly unique SKI indices, I also use "run
patterns" to guesstimate turning points in the precious metals'
market. A "run" refers to a pattern of daily up and
down market closing prices. If the market has 3 consecutive days
of higher closing prices, the run is "3 up". If prices
then decline for 2 consecutive days, the run becomes "3 up
and 2 down". If prices then close higher the next day, the
run changes to "2 down and 1 up". Some people have referred
to run patterns as "worms". A run pattern is only completed
after the direction of closing prices has changed. I have compiled
a listing of every run pattern that has ever occurred and generated
probabilities that the end of the run marks a high or a low, moderated
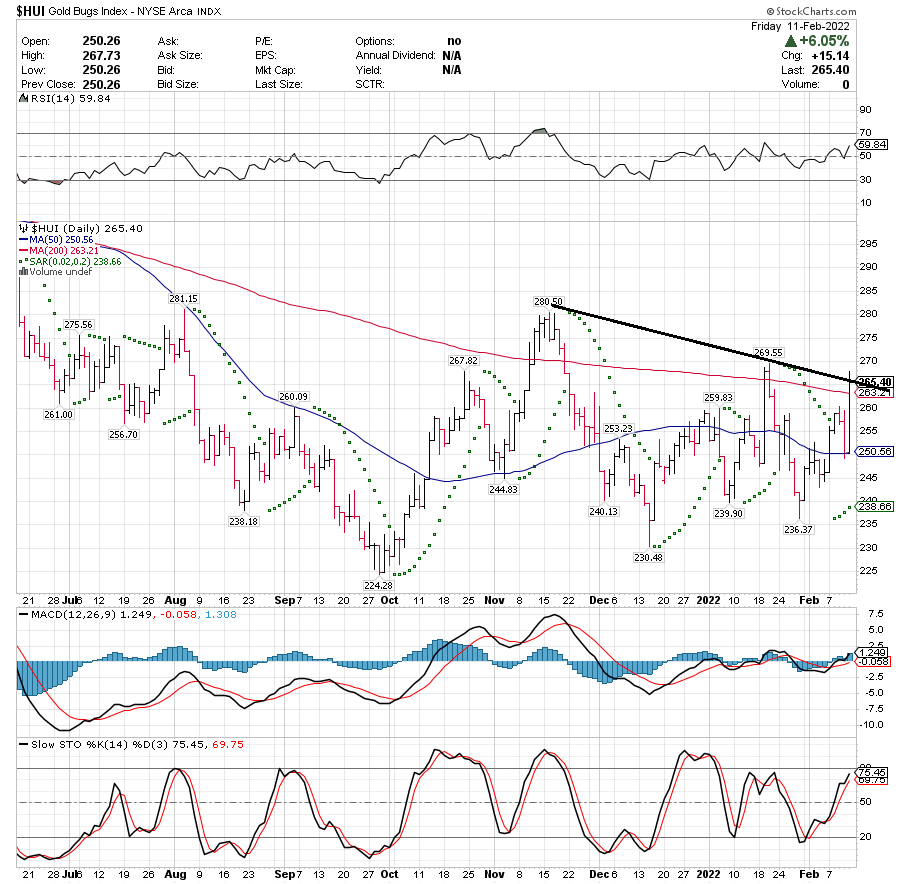
by the indices themselves. New Material The last SKI Report, written on 1/23/22, described how the gold stocks’ rise to USERX 11.94 had yielded a bearish 218-223 index buy AND instant sell on 1/19/22-1/20/22. The master long-term bullish case had been rejected (again) BUT the decline had yielded a second short-term 16-20 index buy signal that was going to execute on Monday, 1/24/22. Mechanical SKI was buying again for some (at least short-term) rise. And IF the gold stocks could bottom and rise, a bullish Triple Buy index pattern was “set-up” (possible). Such a Triple Buy last occurred in early December 2002. A Triple Buy consists of a 16-20 index buy signal, followed by 35-39 and 92-96 index buy signals BEFORE a rise to a resistance 16-20 index sell signal. The 16-20 index buys on declines and sells on rise (as a contrarian index). The gold stocks dropped solidly during the day on 1/24/22 as the general stock market plunged, but then they rebounded as the DJIA rebounded from a 1000-point drop. USERX only dropped 1.8% to 11.26. A “plunge” into the execution of the 16-20 index’s buy signal would have been more “SKI-desirable”. The SKI indices are usually rather EXACT by generating buy and sell signals 1-day in advance of a significant low or high. After a small rise the next day, the gold stocks and gold tumbled on/after the 1/26/22 U.S. Federal Reserve meeting. USERX declined to a new 1.5-year low at 10.55 as other gold stock indices approached their 2021 lows. The immediate Triple Buy index pattern had been avoided, but was still possible if that was a final “wash-out” low into 1/28/22. Mechanical SKI remained long at a loss. The delayed Commitment of Traders (COT) report, published on 2/03/22, did show a rare BULLISH strong DECREASE in the “smart money” Commercial Traders’ SHORT position (the next to last weekly bar on this chart. Gold and the gold stocks have risen since then. The Triple Buy index pattern needed USERX to be above $11.00 on this past Thursday (2/10/22) in order to GENERATE a Double Buy 92-96 index buy signal (as USERX got above the prices from 92-96 trading days earlier). USERX dropped to 11.08 to generate that buy signal as Jeff sent a Buy Update (because prices are supposed to rise into the next-day execution of such index signals). USERX needed to rise to above 11.52 (a large rise) on Friday (2/11/22) as the 92-96 index’s signal EXECUTED in order to generate the 35-39 index’s Triple Buy signal. Friday’s (2/11/22) rise to USERX 11.54 therefore generated the Triple Buy index pattern (by 2-pennies) with Friday being marked by the execution of a 92-96 index buy signal and this coming Monday (2/14/22) being marked by the 35-39 index’s buy signal. INDEX SIGNALS MARK TECHNICAL POINTS, rather exactly. That’s about as certain a statement as Jeff can make, over and over again. Friday’s rise was “technically SKI-exact” but was/is still “disconcerting/worrisome” because it occurred with “War News”. I haven’t kept a written record of what gold does on such “War News”, but my memory since 1985 is that ALL such news-related rises have only lasted a few hours or 1-2 trading days before gold gives back such gains. The simple technical chart analysis varies depending upon the dependent measure. Gold (GLD) has bullishly “broken out”. But the HUI has only risen to rather exactly reach its downtrend RESISTANCE chart line, see here. In conclusion, again, Friday and Monday were/are index-marked by multiple important signals. USERX has generated the Triple Buy index pattern BUT still needs to rise to above the prices from 16-20 trading days ago in order to complete the pattern via a 16-20 index sell signal. That requires a 2-day rise to above USERX 11.94 (Up 40+ cents). That’s the SKI-index math and 11.94 just “happens to be” (smile for exactness) the high on 1/19/22. SKI indicates that a decline on Monday (2/14/22) could easily generate an instant 35-39 index sell signal, kill the Triple Buy, and Mechanical SKI would sell. The exact price is reserved for subscribers. And with the U.S. Federal Reserve initiating an “expedited” (emergency) meeting on Monday (2/14/22) with possible hawkish action, Jeff can only predict/recommend following Mechanical SKI. Nonetheless, I sincerely hope that this public Update is useful. Best Wishes, Jeff If you are interested in following and learning more about the SKI indices, I'll write another Report in three weeks or you can shell out the big bucks for a SKI subscription. Weekly Updates are available by subscribing for a month (or longer if you're wise and cheap enough to want to save money) at my website www.skigoldstocks.com for the princely sum of $30 (for a one month subscription) or more ($240 for an annual subscription). I also provide more frequent intra-week daily messages/alerts at a slightly higher price along with access to our informative Forum. ###  SKI archives SKI archives
email: jeff@skigoldstocks.com
Jeffrey M. Kern,Ph.D., is an academic psychologist with a specialty in the measurement and prediction of human behavior. The communications provided are for informational purposes only and are not intended to be investment advice or recommendations for specific investment decisions. Dr. Kern is not a registered investment advisor, but is registered as a commodity trading advisor (CTA). The information provided is considered accurate, but cannot be guaranteed. Investments/trading in narrow market segments or gold futures is for individuals willing to accept a higher level of risk for the opportunity of greater returns. Past performance is no guarantee of future performance. His website is www.skigoldstocks.com.
Communications should be sent to: jeff@skigoldstocks.com.
Copyright © 2002-2024 Jeffrey Kern. All Rights Reserved.
321gold Ltd

| 