 Special SKI Report #282 Special SKI Report #282
Bull Market; Short-term Top? Jeffrey M. Kern, Ph.D.
Email: jeff@skigoldstocks.com
USERX | historicals
Written Sunday Jan 15, 2023
Published Jan 16, 2023 Current USERX price = 10.71, Up 98 cents (10.1%) since the last report 3 weeks ago. Introduction (repeated from prior Reports):
I have been using my unique SKI indices
to predict price changes in the precious metals' market for more
than two decades. And my indices continue to mark the critical
points. I have initiated a subscription website since 1/13/06
(yes, Friday the 13th) after having posted free updates for years
at www.321gold.com. SKI is a timing service; although
almost everyone seems to believe that market timing is impossible,
that IS what the SKI indices have done for 36 years.
The SKI indices contain short-term (16-20
trading days), intermediate-term (35-39 trading days), and long-term
(92-96 trading days) indices. A more comprehensive description
of these mathematical indices and their history is found here.
Basically, the indices compare today's price to prices from a
specified prior time period. The name of the index specifies the
time period (e.g., 92-96 index = compare today's price to prices
from 96, 95, 94, 93, and 92 trading days earlier). Although I
use the oldest gold mutual fund, USERX, for analyses, the predictions
are applicable to the broad precious metals' market. I do not
recommend or analyze specific stocks, but my subscribers from
around the world regularly discuss individual issues on our Forum.
In addition to the truly unique SKI indices, I also use "run
patterns" to guesstimate turning points in the precious metals'
market. A "run" refers to a pattern of daily up and
down market closing prices. If the market has 3 consecutive days
of higher closing prices, the run is "3 up". If prices
then decline for 2 consecutive days, the run becomes "3 up
and 2 down". If prices then close higher the next day, the
run changes to "2 down and 1 up". Some people have referred
to run patterns as "worms". A run pattern is only completed
after the direction of closing prices has changed. I have compiled
a listing of every run pattern that has ever occurred and generated
probabilities that the end of the run marks a high or a low, moderated
by the indices themselves. New Material
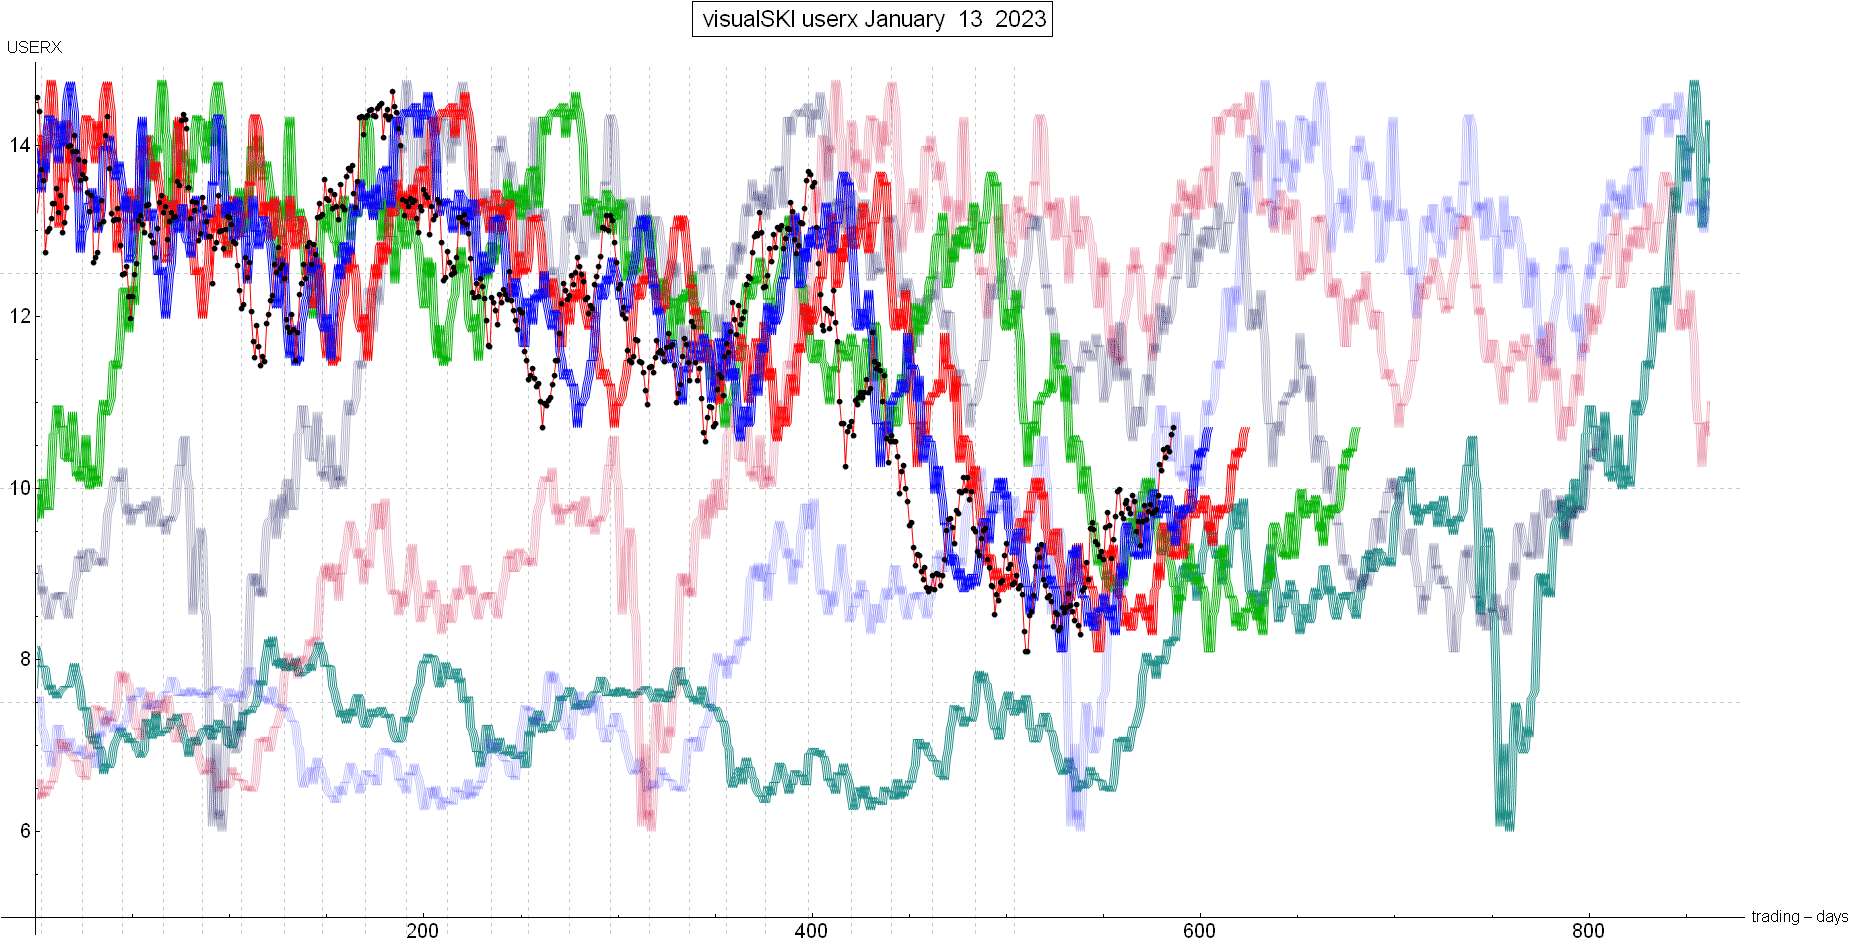
The last SKI Report, written on 12/25/22, described how the second step in the formation of a SKI bull market had been completed. The 3rd and final step in the sequence required some rise during the final week of 2022 or right into the New Year based upon the presented prices for USERX (“THE” diversified measure for this market sector). A decline to the provided USERX prices would generate a dangerously bearish 16-20 index signal. There was 100% mathematical certainty that the bullish or bearish index signal would generate by the start of New Year. Based upon decades of experience, I favored the bullish outcome for Mechanical SKI’s mathematical indices. As has repeatedly occurred since 1974, the bullish sequence is: (1) A rise to above the prices from 92-96 trading days earlier (for a 92-96 index buy signal; likely resistance), (2) A decline to a 92-96 index sell signal, and then (3) A rise back above the index’s back prices. In recent years, this pattern occurred in the March-August 2020 bull, the Summer 2019 rise, and the January-August 2016 bull. Other parallels were 1979-1980, 1993, and Summer 2005 to May 2006. This is the index pattern that has yielded the 50-500% USERX rises. What happened? The gold stocks were flat during the final week of 2022 as USERX rose 2 cents. That avoided either index signal, so the situation had to be resolved at the start of the 2023. And so it resolved on 1/03/2023 via a solid rise (USERX to 9.91) that went above the prices from 92-96 trading days earlier. The likely SKI bull market pattern completed. And the rise continued into this past Friday (1/13/23) at USERX 10.71. The unique feature of our new/likely “baby” bull market is that this past week’s rise quickly went above USERX’s prices from 660-664 trading days earlier. This 663 index is “contrarian”: It sells on rises and buys on declines. Again, don’t ask “why?”. This long-term index actually worked like a short-term indicator (like the contrarian 16-20 index). It only comes into play every few years and then often provides multiple shorter-term buy and sell signals. Here/Now, the 663 index generated its resistance sell signal on Thursday for execution on Friday (1/13/23). The gold stocks are supposed to rise into such sell signals (and they did). Therefore, a short-term top may have just occurred. A rise through this sell signal would be quite immediately bullish. But the typical behavior is a decline back below the prices from almost 2.75 years ago to generate the next 663 index BUY signal. In 2022, the index executed buy signals on the 12/20/22 low (1 day late), and on the exact 7/25/22 low. I’ll reserve the specific 663 index’s Price X Time details for SKIers. But here’s the current SKI USERX chart. The black dots are the USERX price. The faded blue thick line is the 663 index which the black dots have just risen to. The chart is not as exact as the mathematical computation for the index because USERX has just mathematically gone above the index. Nonetheless, you should be able to see that the faded blue line is above to decline. Therefore, it takes a decline to below the index line to generate a 663 index buy. AND THEN THE INDEX LINE ROCKETS HIGHER during the 2020 COVID-bull. If the gold stocks do decline to a 663 index buy, the ensuing rise can therefore be quite extended and powerful. It’s been 2.5 years since that 2020 bull market. That’s actually a normal-to-short time period between SKI bull markets. Subscribers receive more detailed, specific, and comprehensive daily and/or weekly Updates. Best wishes, Jeff If you are interested in following and learning more about the SKI indices, I'll write another Report in three weeks or you can shell out the big bucks for a SKI subscription. Weekly Updates are available by subscribing for a month (or longer if you're wise and cheap enough to want to save money) at my website www.skigoldstocks.com for the princely sum of $30 (for a one month subscription) or more ($240 for an annual subscription). I also provide more frequent intra-week daily messages/alerts at a slightly higher price along with access to our informative Forum. ###  SKI archives SKI archives
email: jeff@skigoldstocks.com
Jeffrey M. Kern,Ph.D., is an academic psychologist with a specialty in the measurement and prediction of human behavior. The communications provided are for informational purposes only and are not intended to be investment advice or recommendations for specific investment decisions. Dr. Kern is not a registered investment advisor, but is registered as a commodity trading advisor (CTA). The information provided is considered accurate, but cannot be guaranteed. Investments/trading in narrow market segments or gold futures is for individuals willing to accept a higher level of risk for the opportunity of greater returns. Past performance is no guarantee of future performance. His website is www.skigoldstocks.com.
Communications should be sent to: jeff@skigoldstocks.com.
Copyright © 2002-2024 Jeffrey Kern. All Rights Reserved.
321gold Ltd

| 