 Special SKI Report #247 Special SKI Report #247
Gold Stock Update: SKI is Open Jeffrey M. Kern, Ph.D.
Email: jeff@skigoldstocks.com
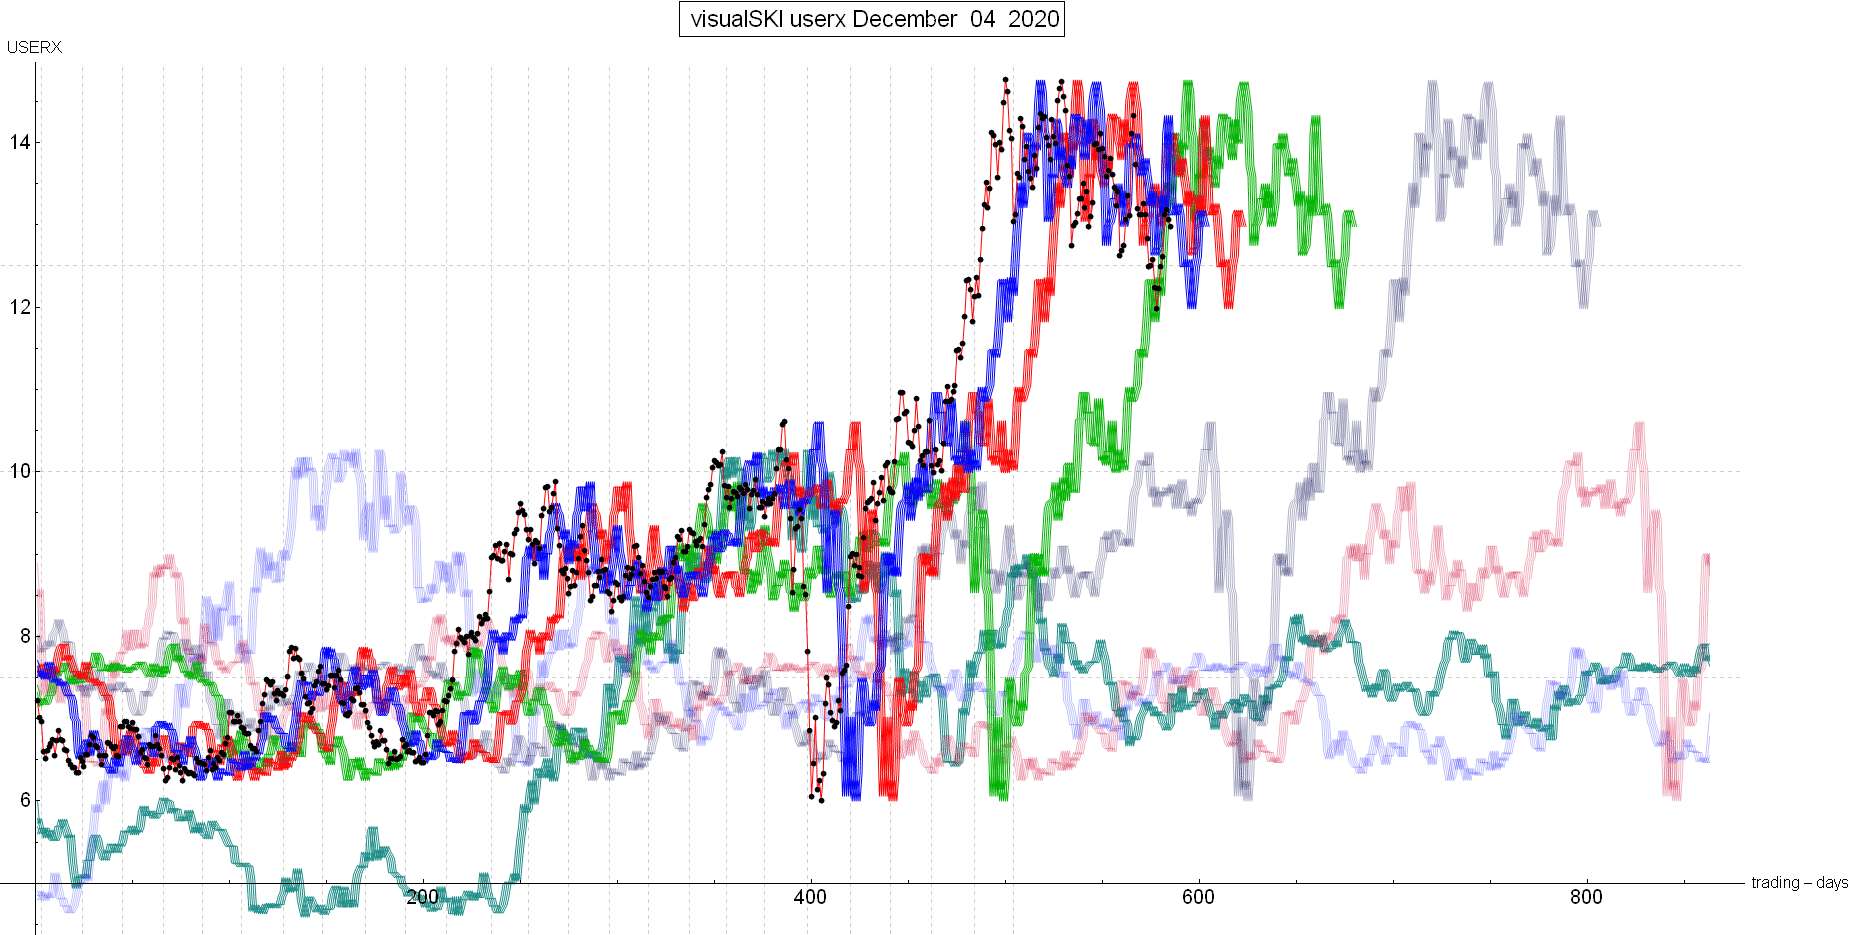
USERX | historicals
Written Sunday Jan 3, 2021
Published Jan 4, 2021 Current USERX price = 13.53, Up 55 cents (4.2%) since the last report 4 weeks ago. Introduction (repeated from prior Reports):
I have been using my unique SKI indices
to predict price changes in the precious metals' market for more
than two decades. And my indices continue to mark the critical
points. I have initiated a subscription website since 1/13/06
(yes, Friday the 13th) after having posted free updates for years
at www.321gold.com. SKI is a timing service; although
almost everyone seems to believe that market timing is impossible,
that IS what the SKI indices have done for 36 years.
The SKI indices contain short-term (16-20
trading days), intermediate-term (35-39 trading days), and long-term
(92-96 trading days) indices. A more comprehensive description
of these mathematical indices and their history is found here.
Basically, the indices compare today's price to prices from a
specified prior time period. The name of the index specifies the
time period (e.g., 92-96 index = compare today's price to prices
from 96, 95, 94, 93, and 92 trading days earlier). Although I
use the oldest gold mutual fund, USERX, for analyses, the predictions
are applicable to the broad precious metals' market. I do not
recommend or analyze specific stocks, but my subscribers from
around the world regularly discuss individual issues on our Forum.
In addition to the truly unique SKI indices, I also use "run
patterns" to guesstimate turning points in the precious metals'
market. A "run" refers to a pattern of daily up and
down market closing prices. If the market has 3 consecutive days
of higher closing prices, the run is "3 up". If prices
then decline for 2 consecutive days, the run becomes "3 up
and 2 down". If prices then close higher the next day, the
run changes to "2 down and 1 up". Some people have referred
to run patterns as "worms". A run pattern is only completed
after the direction of closing prices has changed. I have compiled
a listing of every run pattern that has ever occurred and generated
probabilities that the end of the run marks a high or a low, moderated
by the indices themselves. New Material The last SKI Report, written on 12/06/20, described how the decline into USERX 11.98 on 11/24/20 had reached the master 92-96 index (the prices from 92-96 trading days earlier). The ensuing 5-day strong rise had kept USERX barely above that index at 13.18, but the decline on 12/03/20 had generated the master 92-96 index’s sell signal. The accompanying chart of the SKI indices showed how USERX was below all 3 of the regular indices: The blue line 16-20 index, the red line 35-39 index and the master green line 92-96 index in a bearish manner. A further decline on Monday (12/07/20) would look bearish. The gold stocks avoided that bearishness by rising solidly on 12/07/20 to USERX 13.30. But the indices would remain in a bearish configuration: The 16-20 index was below the 35 index, the 35-39 index was below the 92-96 index, and the 92-96 index was the highest index. In order to avoid a bear market, USERX needed to rise to a 16-20 index sell signal. Remember that the 16-20 index is contrarian: A rise to above the prices from 16-20 trading days earlier generates that first resistance sell signal. After that sell signal, a decline would yield a 16-20 index buy signal for a low OR the gold stocks would then hold up enough to generate a 35-39 index buy signal. Mechanical SKI would buy such a 35-39 index buy signal and use a 35-39 index sell signal as a sell-stop. The gold stocks DID do the needed rise into a 16-20 index sell signal. The rise on 12/16/20 went over the prices from a month earlier to generate the first resistance sell signal. The buy executes the next day. Prices typically rise into such resistance. Therefore, the resistance sell signal executed on 12/17/20 at USERX 13.41 with the HUI at 312.05. The gold stocks would then either decline to a 16-20 index buy signal OR would stay up enough to generate the 35-39 index’s buy signal. Mechanical SKI would buy either index signal (but that resistance sell signal has been the December high for the relatively weak HUI). The subsequent 3-day decline back to USERX 12.90 wasn’t large enough to generate the 16-20 index’s buy signal. The decline also was not large enough to stay below the DECLINING 35-39 index’s 5 back prices that were at the 10/28/20 low of 13.41, 12.63, 12.69, 12.75, 13.07, and 13.36. Therefore, the 35-39 index’s buy signal generated and executed the next day (12/23/20) as Mechanical SKI bought at USERX 13.11. But as those 5 back prices showed, they were beginning a strong rise. Therefore, the gold stocks needed to rise and rise strongly to stay above those rising back prices to stay above the 35-39 index. The rise occurred into this past Wednesday (12/30/20) at USERX 13.58. It hit/touched the master 92-96 index with its back prices at 13.62, 13.57, 14.29, 14.20, and 13.79. But the rise needed to continue and Thursday’s (12/31/20) small decline to USERX 13.53 generated the 35-39 index’s sell signal. Therefore, Mechanical SKI is being stopped out at a small profit on this short-term trade. NOW, as we head into the technically/psychologically important first week of the New Year, SKI is “open” for bearishness or bullishness. We mathematically know (100%) that the 35-39 index WILL re-buy unless USERX plunges to below the 11/24/20 low area of 11.98-12.24 during the next 8-12 trading days. Therefore, Mechanical SKI is “somehow” eliminating the risk of being long on a decline to new multi-month lows SKI will buy again if prices rise OR if the gold stocks decline but hold above that 11/24/20 low area. A Buy Update would be sent if the 35-39 index generates a new buy signal. Such a buy signal could be quickly followed by the needed master 92-96 index buy signal because that index’s back prices are temporarily dropping to the 8/25/20 low area of USERX 13.65, 13.56, 13.45, 13.84, and 13.68. Have you been following my Updates long enough to “make sense” of the SKI indices? Mechanical SKI is prepared to buy back for the intermediate-term 35-39 index. Happy New Year! Best Wishes, Jeff If you are interested in following and learning more about the SKI indices, I'll write another Report in three weeks or you can shell out the big bucks for a SKI subscription. Weekly Updates are available by subscribing for a month (or longer if you're wise and cheap enough to want to save money) at my website www.skigoldstocks.com for the princely sum of $30 (for a one month subscription) or more ($240 for an annual subscription). I also provide more frequent intra-week daily messages/alerts at a slightly higher price along with access to our informative Forum. ###  SKI archives SKI archives
email: jeff@skigoldstocks.com
Jeffrey M. Kern,Ph.D., is an academic psychologist with a specialty in the measurement and prediction of human behavior. The communications provided are for informational purposes only and are not intended to be investment advice or recommendations for specific investment decisions. Dr. Kern is not a registered investment advisor, but is registered as a commodity trading advisor (CTA). The information provided is considered accurate, but cannot be guaranteed. Investments/trading in narrow market segments or gold futures is for individuals willing to accept a higher level of risk for the opportunity of greater returns. Past performance is no guarantee of future performance. His website is www.skigoldstocks.com.
Communications should be sent to: jeff@skigoldstocks.com.
Copyright © 2002-2024 Jeffrey Kern. All Rights Reserved.
321gold Ltd

| 