 Gold Mining
Stocks: Is the Correction Over Gold Mining
Stocks: Is the Correction Over
Kenneth J.
Gerbino
Archives
Kenneth J.
Gerbino & Company
May 24, 2006
The recent sell off in
the mining stocks was brutal and half of the decline took place
in 48 hours. At this point it is important to analyze the major
macro reasons mining stocks are good investments. You all know
most of these; Global money supply increases, excessive debt,
demand - supply imbalances of most minerals due to China and
India, world tensions regarding the mid-east and possible huge
financial imbalances due to excessive derivative speculation.
The two charts below, I believe,
are as important to precious metal and base metal stock investors.
These charts show how basically undervalued the mining sector
is based on real world factors. These two charts tell us the
big move in these mining stocks is ahead of us not behind us.
The chart below shows the CRB
(Commodity Research Bureau) World Commodity Index. We have adjusted
this by the CPI from 1963. It shows in real terms that
the commodity move of the last five years is just in a beginning
stage.
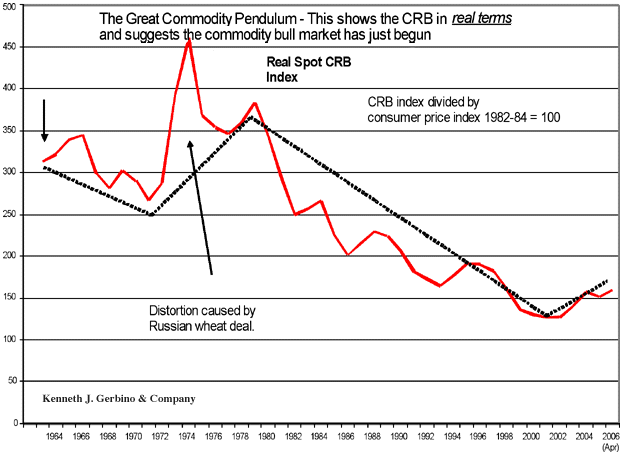
Even with the roaring bull
market in the metal markets and in other commodities, the actual
real values have not even approached the price levels people
accepted as normal back in the 60's in the U.S. This means in
real terms the CRB needs to at least double from here in order
to just catch up with the 60's. At that point these commodities
will again be influenced by future inflation over the next 5-10
years. It is not inconceivable to anticipate commodity prices
to rise much more in the future. In the great commodity boom
of 1970-73, prices went way beyond any of the values expected
by the floor traders, analysts, brokers and the commercials.
The reason was that a huge macro-economic wave of paper money
increases from the last 20 years and the Russian wheat deal combined
to move nominal prices (not shown on the graph) up dramatically.
Gold and silver, base metals
and other commodities could go much higher.
The next graph takes the Gold
price and divides the price by the value of the XAU (Philadelphia
Gold and Silver Mining Index). This shows if the mining stocks
are under or overvalued in relation to the gold price. The higher
the graph the more undervalued the shares are in
relation to the present gold price. Gold stocks are currently
more undervalued as of Friday (19th May) than they were on 7
Oct. 2006 when gold was $474 an ounce.
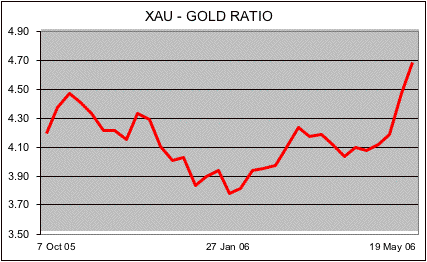
The above graph is short term
in nature and coupled with the first graph which is long term
in nature they clearly show owning the mining stocks is a solid
value proposition.
The metal markets have been
in a strong bull market. Currently a correction has taken place.
Because of its severe and fast decline it may be ending right
here. Pullbacks and consolidations are part of all long term
up-trends. They should be managed and intelligently handled.
Two Distinct Forces
There are now two distinct
forces at play in this metal market that are new to this
century. The normal industrialized world economic cycle
usually increases demand for metals for buildings, cars, infrastructure
etc. When the economic expansion runs out of steam, a recession
ensues and metal prices decline as demand decreases. Now there
is something new.
The two new forces are 1) metal
demand from the industrialized world economic cycle is now second
fiddle to China and India (developing countries) who are consuming
vast amounts of natural resources and 2) Not enough large mineral
deposits are being found to sustain the demand from global population
increases. This, along with currency depreciation, is why copper,
zinc, other minerals and precious metals are moving higher.
The Third Force
Wall Street momentum players
and high powered hedge funds with trillions to invest are also
now involved with the natural resource sector. Prices have been
going higher from real demand and speculation, but there is another
third force - a sea of liquidity (money and credit) increasing
globally.
India in the last five years
has averaged about 16% a year in money supply increases and they
are currently at 22%. When someone tells me silver is too high,
the billion plus people in India could care less if silver
moves down a few rupees when their entire life savings could
go up in smoke as their government continues to debase the local
currency. China has had annual money supply increases over
12% for ten straight years - currently at 17%. The U.K.
has averaged 9% for the last five years and the U.S., 7% per
year for the last five years. In an honest economic system
zero money supply increase is the ideal. Higher prices
for almost everything are coming. One needs to have a hedged
economic posture and that means a core position in gold and silver
and the mining stocks.
The correction we have just
witnessed appears to be over but there will be many more in the
future. Stay with solid merchandise and make sure to take something
off the table when valuations of certain stocks you own get out
of hand and use that cash to re-enter the market on sell-offs.
But always keep a core position.
Please visit
our website for more articles
on gold, the economy and stock market.
23 May, 2006
Kenneth J. Gerbino

Archives Kenneth J. Gerbino & Company
Investment Management
9595 Wilshire Boulevard, Suite 303
Beverly Hills, California 90212
Telephone (310) 550-6304
Fax (310) 550-0814
E-Mail: kjgco@att.net
Website: www.kengerbino.com Copyright ©2004-2016 Kenneth J. Gerbino & Company. All Rights Reserved.
321gold Inc

|
