Super Force Signals - A Leading
Market Timing Service
We Take Every Trade Ourselves
The Golden Countdown
Morris Hubbartt
Weekly Market Update Excerpt
posted Oct 12, 2012
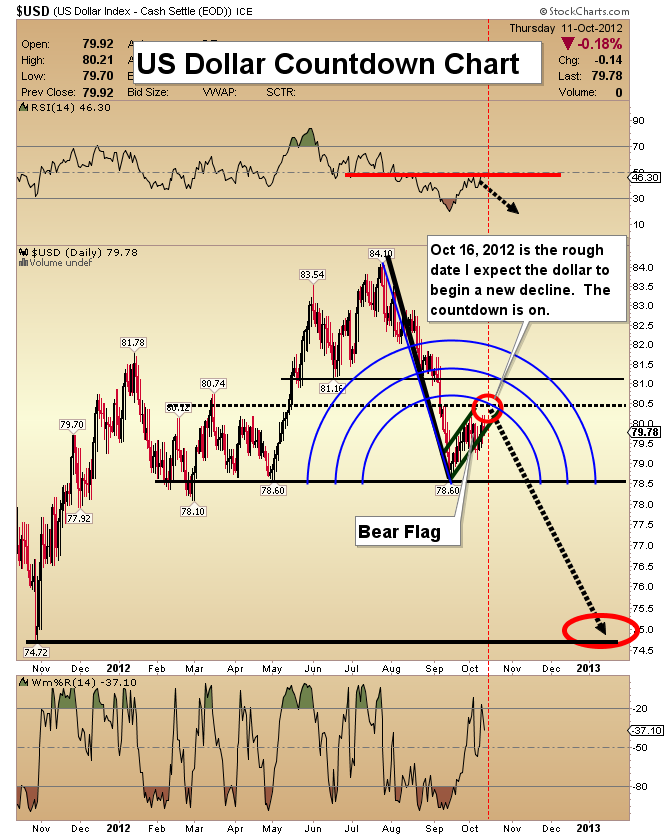
US Dollar Countdown Chart
- At this point, the US election could probably go either way. Many analysts believe a Romney victory would be dollar-positive, and gold-negative. As I study the US debt and unfunded liabilities, my conclusion is that the dollar will continue to decline, regardless of who is elected.
- My technical analysis of the dollar is not targeted at fiat currency traders. It is to assist physical gold buyers to purchase gold, at ideal price points.
- Longer term, I see the dollar bouncing off of the 71 area, and then plunging to new lows. I call this chart the “countdown” chart, because I believe that by approximately October 16th, the dollar will begin a new leg down, and gold will begin a new leg higher.
- My time target is based upon the price resistance I see at 80.50, the size of the bear flag, and the location of the inner Fibonacci arc.
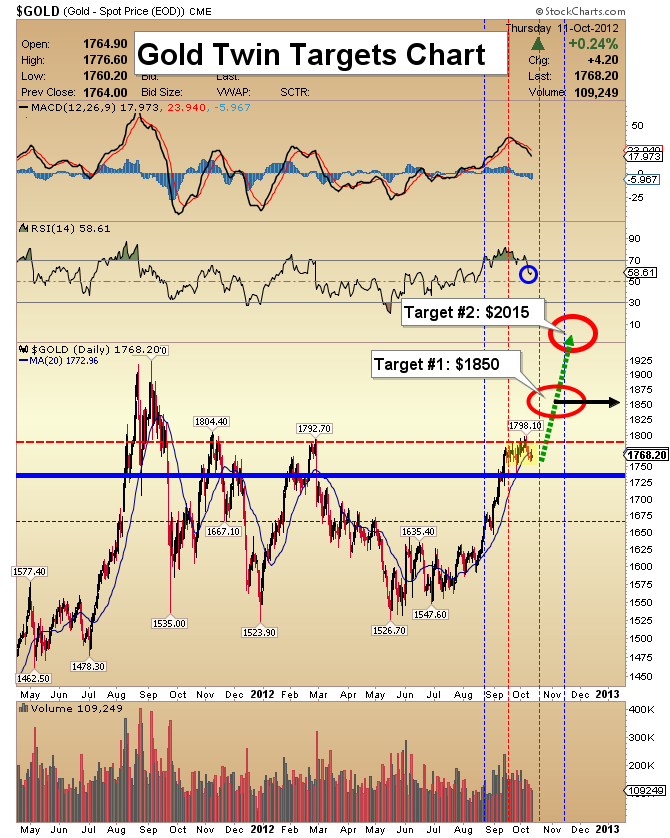
Gold Twin Targets Chart
- The “Commitment of Traders” (COT) report shows overzealous public and funds buying gold aggressively, while the “smart money” bankers are adding relatively large short positions.
- Many investors believe that the latest COT reports prove that a large correction in gold and silver has started. I think that may be an over-simplistic evaluation of large liquidity flows.
- The amount of money that was poured into the gold and silver market in the past 12 months by commercial traders is quite extraordinary.
- Profit taking by commercial traders is not unusual after a rally like this. After a major bottom has occurred, a pause in the upwards price action is quite typical.
- I am projecting that gold will suffer no more than a 4% drawdown from the recent highs. Hold your core positions, and accumulate a bit more on any 2% decline.
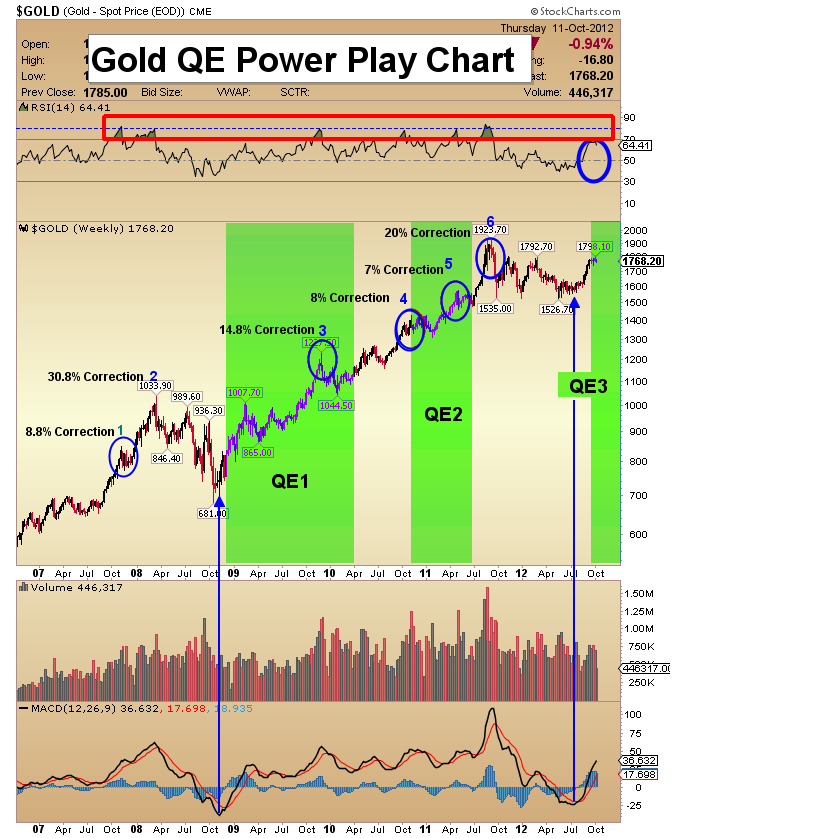
Gold QE Power Chart
- This chart indicates that the gold price has quite a ways to go on the upside, before the next serious correction occurs.
- The RSI indicator has not reached the red danger zone that I’ve highlighted. Strong bullish moves often occur right before the price goes into that overbought area, above 70.
- QE1 & QE2 had a profound effect on the price of gold. During the euro crisis, QE2 may have stopped the dollar from rallying significantly.
- The current round of QE has just started, so this rally in gold may be equated to the age of a newborn baby. Over the next 12 months, I expect QE3 to increase the size and velocity of the US dollar “snowball”, and create the strongest leg of the gold bull market. My intermediate trend targets are $1850 & $2015.
- From $2015, I expect a more significant price retracement, and then a move up to my primary trend targets, which are $2300 and $2850. I am projecting that gold reaches all these prices, within twelve months.
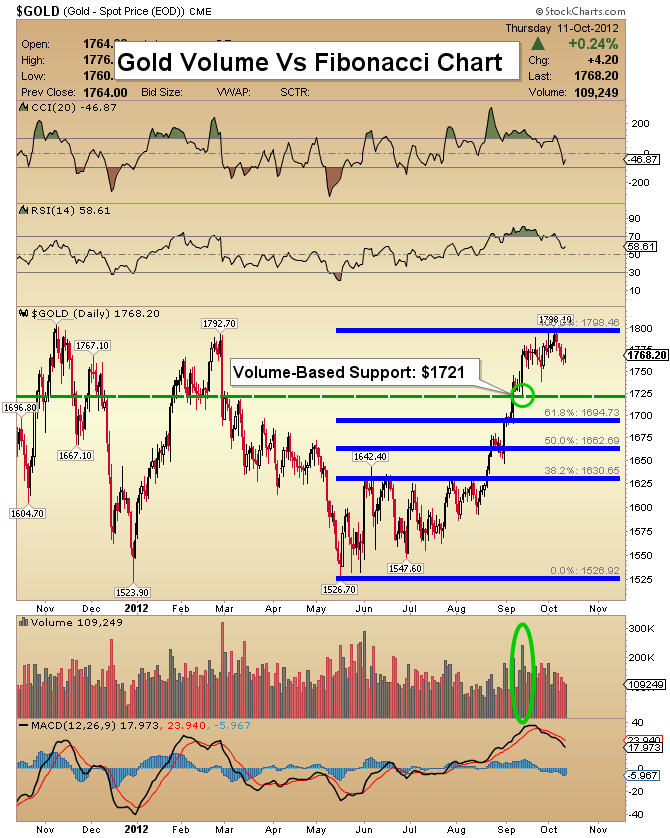
Gold Volume Vs. Fibonacci Chart
- This chart displays important Fibonacci retracement lines. Many technicians are using these now, to highlight possible buying areas on a correction.
- I think that’s a bit premature, because I don’t believe this intermediate trend higher has been completed. The Fibonacci lines should prove to be more practical, once gold is trading near $1850.
- For now, my maximum retracement target is the volume-based support at $1721. That’s quite a bit higher than the “Fib” line in the $1695 area.
- Gold is likely pausing very briefly, rather than beginning a significant price correction. Volume patterns suggest that the intermediate bull trend will resume within days.
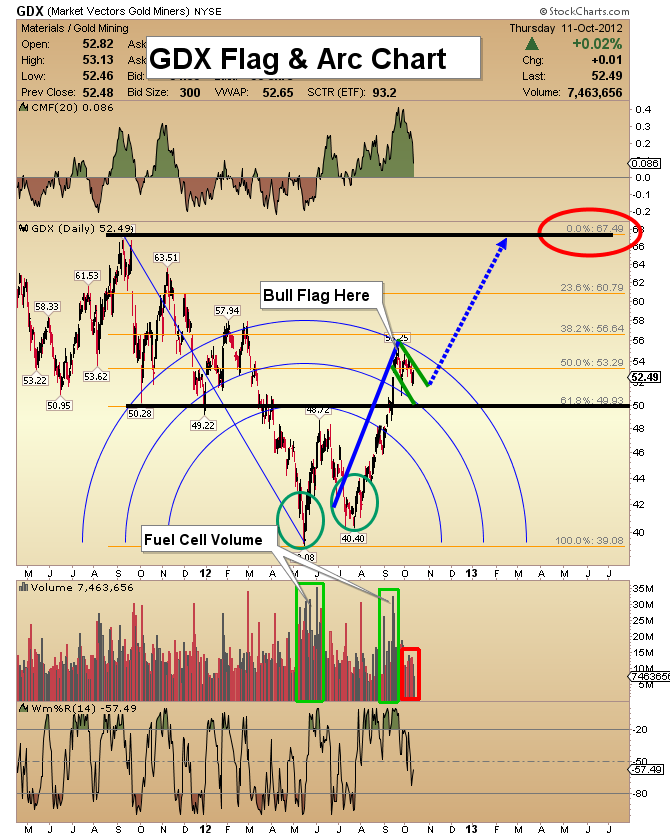
GDX Arc & Flag Chart
- As gold stocks were making a bottom in May, I used Fibonacci arc charts to forecast how GDX would move upwards. Now that the outer arc price has been almost acquired, what’s next?
- There is an important bull flag pattern that is taking shape nicely. It is accompanied by light volume, which is bullish. GDX seems to be setting up to launch a high-volume move to the upside.
- I have suggested that my $66 target could be replaced with a higher one, at about $72. The bull flag within the arc pattern makes it very likely that GDX could acquire a minimum price of $70, by Dec 31.
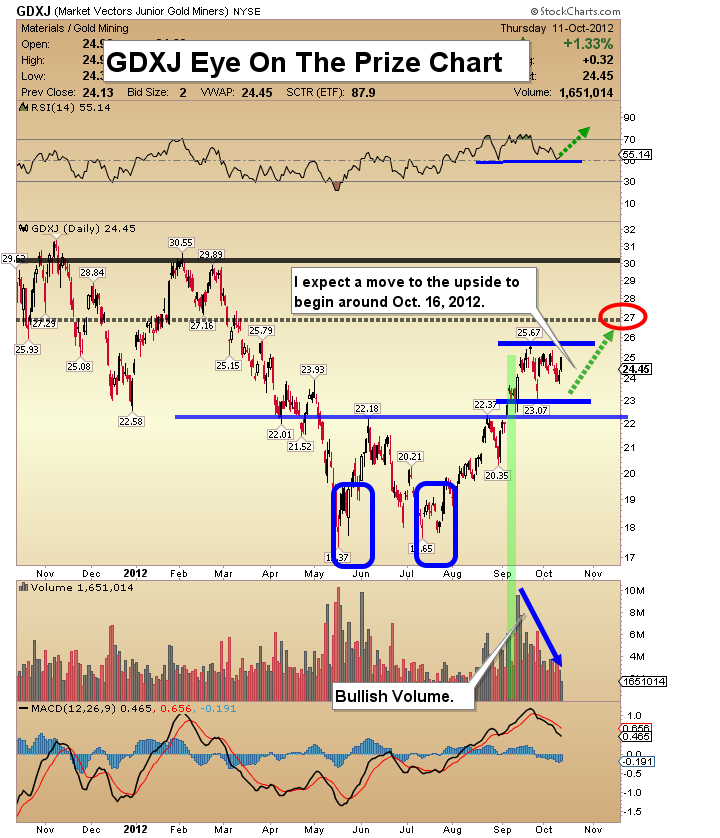
GDXJ Eye on the Prize Chart
- A quiet digestive period after a big rally is continuing in GDXJ. This action is normal and healthy.
- Junior gold stocks are a compelling buy, even after rising almost 50% from the May lows.
- Note the position of the RSI oscillator, near 50. Momentum-based moves can occur from here.
- Volume is extremely bullish, and I expect GDXJ could lead GDX again on the next leg higher, as it did on this one.
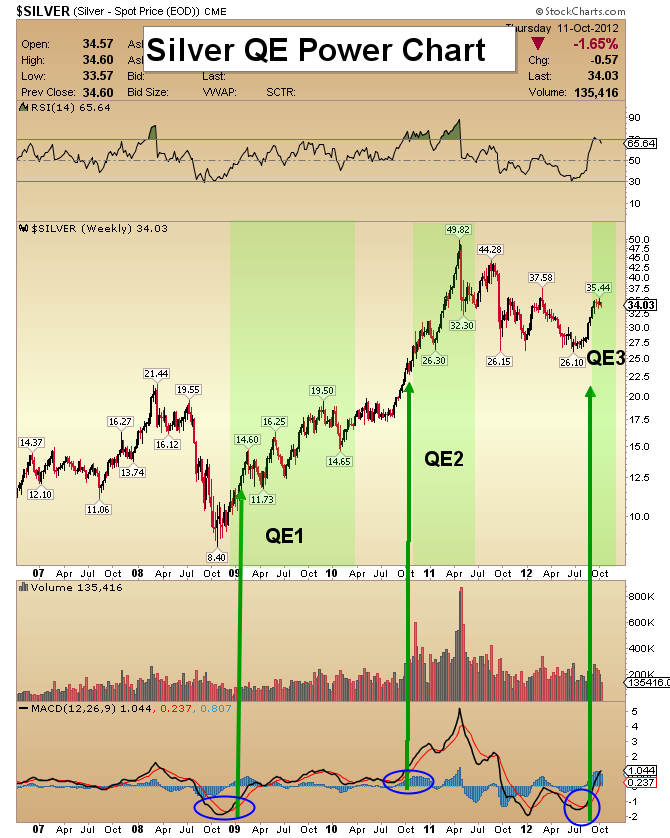
Silver QE Power Chart
- The last few employment reports have likely done nothing to change Ben Bernanke’s views; QE is slated to run for an “unlimited” amount of time. That’s very bullish for silver.
- We are in a debt crisis, in a fiat currency world. Paper currencies will be produced out of thin air, and silver remains an excellent asset to protect yourself.
- Please note how low the MACD indicator is on this weekly chart. It suggests that silver can run much higher, before becoming overvalued.
- When the 3rd primary advance gets underway in a major bull market, investors may do better by trading less, and investing more. Concentrate on building the size of core positions. Let the profits ride, at least until gold gets close to $2015!
Friday, Apr 19, 2024 Super Force Signals Unique Introduction For 321Gold Readers:
Send an email to admin@supergoldsignals.com and I’ll send you my free “Inflation Thunder Now!” gold stocks video report. I’ll also include 3 of my next Super Force Surge Signals free of charge, as I send them to paid subscribers. Thank you!
|
The SuperForce
Proprietary SURGE index SIGNALS:
25 Surge
Index Buy or 25 Surge Index Sell: Solid Power.
50 Surge Index Buy or 50 Surge Index Sell: Stronger Power.
75 Surge Index Buy or 75 Surge Index Sell: Maximum Power.
100 Surge Index Buy or 100 Surge Index Sell: "Over The Top"
Power.
Stay alert for our surge signals, sent by email to subscribers,
for both the daily charts on Super Force Signals at www.supergoldsignals.com and for the 60 minute
charts at www.supergoldsignals.com
About Super
Force Signals:
Our Surge Index Signals are created thru our proprietary blend
of the highest quality technical analysis and many years of successful
business building. We are two business owners with excellent synergy.
We understand risk and reward. Our subscribers are generally successfully
business owners, people like yourself with speculative funds,
looking for serious management of your risk and reward in the
market.
Frank Johnson:
Executive Editor, Macro Risk Manager.
Morris Hubbartt: Chief Market Analyst, Trading Risk Specialist.
website: www.supergoldsignals.com
email:
admin@supergoldsignals.com
email: admin@supergold60.com
SFS Web Services
1170 Bay Street, Suite #143
Toronto, Ontario, M5S 2B4
Canada
###
Oct 12, 2012
Morris Hubbartt
321gold
Ltd

|
