|
|||
Commodities: a Technical UpdateBruce Zaro With the gut-wrenching volatility we've seen in commodities markets lately, it seemed an appropriate time to take a look at some key components in this group. CRB Index The CRB has, of course, been volatile lately, but recent action smashed all hope of the trend line staying intact. An un-weighted geometric average of commodity price levels, this index covers a very broad mix of materials, including all the usual metals, textiles and fibers, livestock and foodstuffs and other raw materials like cotton and rubber. Thus, a picture of the CRB is worth a thousand words for the trend in materials: 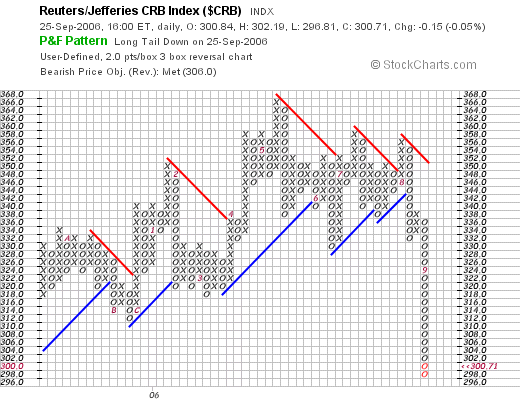 Currently, most commodities are very oversold and due for a bounce. The CRB itself is probably is no exception as it has already fully realized a bearish price objective in the low $300's and its momentum has been negative for 7 weeks (the average time a chart displays negative momentum is 8 weeks). Aggressive bottom-fishers can look to nibble right now, but the negatives far outweigh the positives here from a long-term technical standpoint, including the recent violation of the bullish trend line and relative strength, a reliable long-term indicator, which is weakening and close to a sell signal. Copper Copper recently broke down and violated its trend line that saw its price move from $.64 to over $4.00, a bullish trend which had been in place since October of 2001. After copper reached its $4.04 peak in May, it sold off 25% in June to the $3.00 range. The subsequent bounce up to the $3.40 - $3.60 range was never able to regain the momentum it had earlier in the spring: 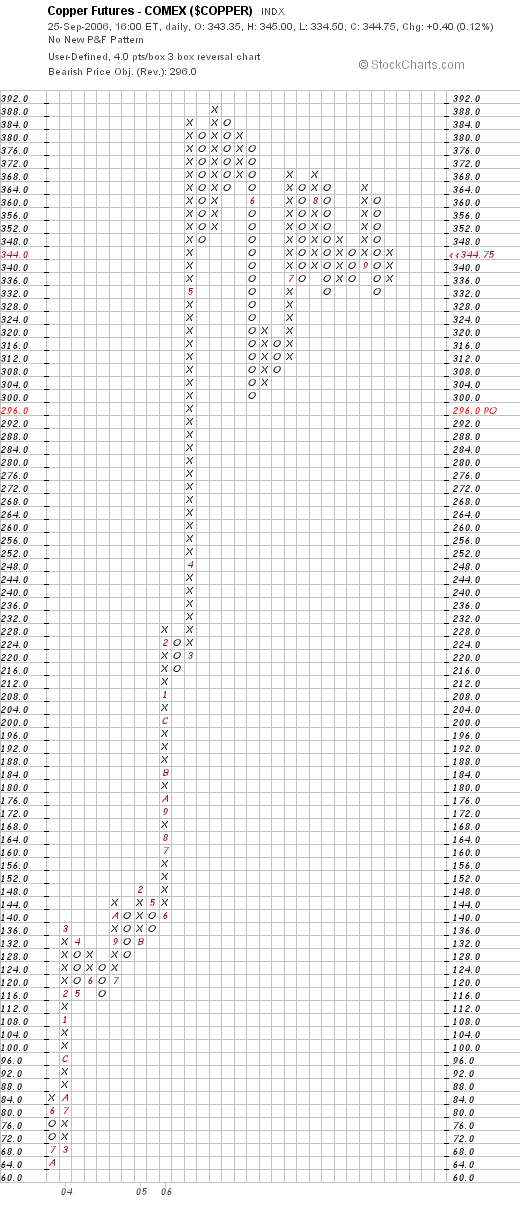 With such moves, consolidation around the mid point of a trading range is typical action but if we don't see a meaningful push from here, preferably to new highs, then any bounce from here is likely to fail. Technically, copper does not look as unhealthy as many other commodities (which also puts a question mark over recent recession fears), so it can be given a little more rope. This theory, however, would be enhanced if it does manage an upside break at $3.72. Barring such a performance, we would use a weak rally that fails below that level to lighten up on copper exposure. Gold Gold peak in May at $724, in the heart of the commodity boom pricing that saw no shortage of predictions for $1000/ounce by year's end. Commodities have a long history of moving up and down dramatically, something investors were reminded of this summer. Certainly, a slowing economy and thus reduced inflation expectations have played a part in gold's recent pattern of lower highs and lower lows, but its recent plunge should be considered particularly bothersome: 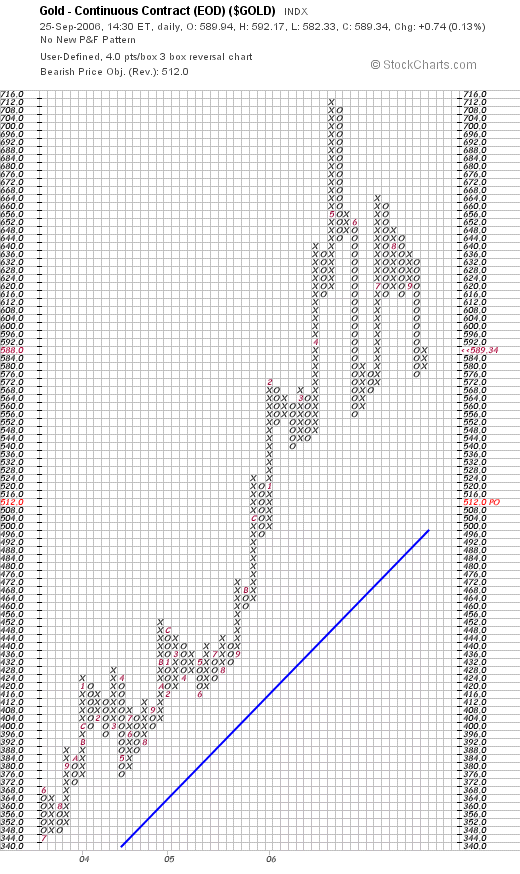 Gold's recent move below $600 violated the Point and Figure bullish support line (can't be reproduced on these charts), which is an important signal to keep in mind. This same trend line had been in place since October of 2001. In addition, the relative strength of gold versus the S&P 500 weakened significantly in early September, although it has not given an outright sell signal. Further declines in gold or strength in that broad U.S. stock market index would suggest to us that a more aggressive move out of gold might be in order. While gold is deeply oversold on a short-term basis and a bounce could occur anytime, a move into the $625-$650 range would likely amount to a timely opportunity to roll out of some gold exposure. Conclusion Commodities are indeed grossly oversold at the moment, generally speaking, and could rally at any time. That being said, enough technical damage has been done that bounces from here, which could be quite meaningful, should not necessarily be taken as a sign that the bull market in commodities remains intact. I'm not predicting the commodity market's demise, mind you; I'd prefer to see more evidence before making that call. Those who are offering such forecasts, however, might be proven right should we see poor, failed rally attempts in coming weeks. **Does the pullback in oil and gas provide an opportunity? If so, are Canadian trusts worth considering for energy exposure right now? For starters, get "Go North!" our exclusive, free report on Canadian royalty trusts by visiting: http://www.deltaga.com/reportForm.asp?rep=2 Sep 26, 2006 Over his 20-year investment career, Mr. Zaro has become a highly-regarded technical analyst who runs private client portfolios at Delta Global. For the last year he served as Managing Director of Granite Wealth Management outside of Boston and spent nearly 15 years prior as a Vice President at Gage Wiley & Co. His current firm is full-service, but specializes in providing international market access as well as alternative investment strategies.
321gold Inc |
