|
|||
HUI UpdateRoland Watson Some weeks back we looked at how the HUI index of unhedged gold producers was leveraging the price of gold. As any seasoned gold investor will know, well chosen gold mining stocks offer gearing on the rising price of gold up to many times depending on the quality and timing of the stock chosen. However, since 2004, the HUI has failed to live up to that tag as its performance against gold has increasingly diminished until recently. To this end, we present the latest on how the HUI is doing against its main product. As before, we calculate a rolling four year leverage to best display how this basket of gold stocks is leveraging gold. A four year period was chosen because it smooths out any volatile price moves and represents the typical time that an investor may hold onto stocks during such a bull market. The graph below gives the current state of play. 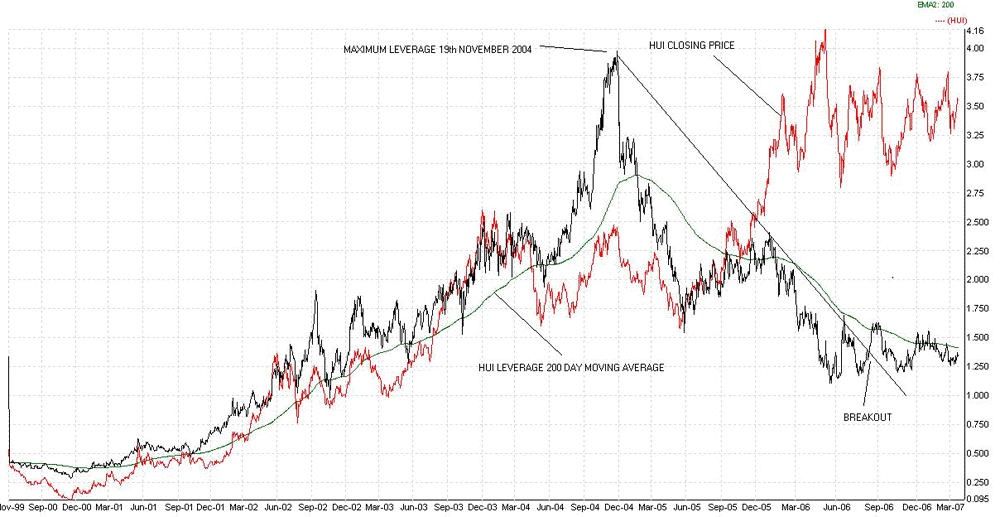 As you can see, the HUI hit a peak of leverage against gold on the 19th November 2004 when over a four year period it had outperformed gold by a factor of 3.92 or a near 400% return over gold. No wonder people like gold stocks you may say. However, for reasons not quite understood, that four year leveraged return began to drop to the extent that even silver began to and still does outperform the HUI index. A bottom of about 1.10 was hit in May 2006. In other words, someone who broadly invested in the HUI stocks four years earlier in May 2004 by May 2006 had seen his portfolio return a meager 10% over the price appreciation of gold. Not quite what we would call aggressive leveraging. Various fundamental reasons have been offered for why this shocking performance has come about. Rising energy and infrastructure costs have been suggested. Others have said that rising geopolitical tensions have made HUI companies based in not so friendly countries less attractive to investors. Finally, the rise of gold ETFs and their accessibility to stock-based mutual funds has no doubt seen money traditionally intended for stable gold producers diverted away. Whatever the reasons, the leverage numbers reflects this malaise. So what now? A look at the chart confirms the bullish sentiment I gave at the time. If we draw a trendline down from the top of the graph, there was a breakout in August 2006. At that point the HUI was dropping to 300 and less as it continued to correct its 400 high. This breakout buy signal has been confirmed in the intervening months as the HUI leverage consolidates in the 1.25 to 1.60 range. Will it drop any further? I say that is next to improbable if not impossible. For the HUI leverage to drop back below the downtrend, it would have to drop below 1.0. In other words, the basket of HUI stocks would have to be under-performing gold. That to my mind is not feasible in a rising gold market. I think investors can continue to regard the period since the leverage breakout as a buy zone for gold stocks. The final confirmation will come when the HUI leverage rises and stays above its 200 day moving average. When that happens expect the leverage that gold stocks deliver over gold to start increasing. Further analysis using our various indicators and more can be had by going to our silver blog at http://silveranalyst.blogspot.com where readers can obtain the first issue of The Silver Analyst free and learn about subscription details. Comments and questions are also invited via email to silveranalysis@yahoo.co.uk Mar 30, 2007 321gold Ltd |
