|
|||
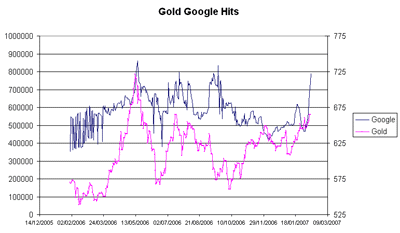
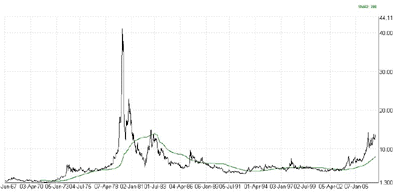
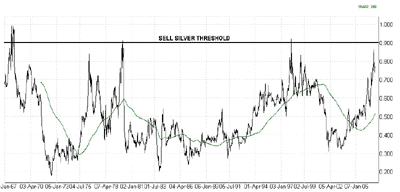
Gold, Google and Market TopsRoland Watson It has been a while since we last published how our gold and silver sentiment indicator has been getting on. To remind readers, for the past year now I have been collecting the number of Google hits on key phrases relevant to the gold bull market. Care has been taken that one does not end up with hits related to the latest fashions in gold jewelry or what the latest theories are on some gold artifacts found in archaeological digs. We are only interested in the gold bull market and I hope the hits collected over that time reflect that. Now we are at an interesting juncture in the world of gold and Google. Have a look at the chart below which superimposes the daily gold price upon the number of Google hits.  Not unsurprisingly, the number of Google hits follows the gold price. That is basic investor psychology, as the price of an asset becomes more attractive, more people want to know about it and that is reflected in Internet search engines such as Google. However, for this chart we are at a crossroads. For the whole year, this chart has moved in a range between 400,000 and 850,000 Google hits. But now and suddenly, the indicator has surged from just under 500,000 to leap to a high of 849,000 as of today. The interesting thing is that this 850,000 level has proved to be a level of resistance to gold prices in the last year. Three times gold prices have risen and the corresponding Google hits have approached this level only to bounce off it and also be matched by a drop in gold prices. What is going to happen this time? Either the indicator is going to bounce off again or it will be fourth time lucky as it surges on and signals the resumption of the gold bull market. That is why I suggested we are at an interesting juncture. Of course, what is bullish for gold is bullish for silver but silver sometimes has a habit of lagging gold as investors wait to see how gold behaves. But if we exceed 900,000 hits on this graph, it is another nail in the price correction story. Meanwhile, our new long term indicator for silver and gold, the Silver Leverage Indicator (or SLI), continues to trace its own unique path. I reproduce the graphs again to remind you of its predictive power.   One thing I would like to point out is that when I said its sell signal would be a potentially potent one, I was not implying that this would signal the end of the silver bull market. Though I couldn't tell you if silver is going to be up or down on a particular day or week, we can be more confident about the long term direction. Any higher degree correction that lies ahead will not signal the beginning of another 1980-2000 bear market for the metals. There are too many bullish fundamentals ahead of us to warrant such a conclusion. However, when that SLI sell occurs, we will face a major opportunity to sell some of our holdings with a further view to getting back in at once in a decade price opportunities. It's a long term bull market, but we should expect a couple of smaller bear markets along the way. Further silver analysis can be obtained by going to our silver blog at http://silveranalyst.blogspot.com where readers can obtain the first issue of The Silver Analyst free and learn about subscription details. Comments and questions are also invited via email to silveranalysis@yahoo.co.uk Roland Watson |
