|
|||
Silver UpdateRoland Watson Silver continues to advance this week into the $17 territory and onto a level somewhere we believe in the $20 to $30 range. That difference between $20 and $30 is a lot to investors who are especially leveraged to silver through stocks, options and futures but also to those who hold large quantities of silver be it in ETFs, pool accounts or in other secure deposits. At this point let me give a brief update on how one of our indicators is getting on. I call it the RMAR or "Relative Moving Average Refined". This technical analysis indicator is a sell signal generator working in the multi year range. Typically a sell signal is flagged every few years depending on whether gold and silver is in a major bear or bull market. The indicator is based on the difference between silver and its 200 day moving average. However, that number on its own still leads to false signals; hence a proprietary filter is applied to get the stable results we see in this indicator. Also, the RMAR is primarily a silver indicator but because of the twinned nature of gold and silver, when silver tops gold tends to top as well. As of last week, the RMAR had a value of 0.97 which means it is about 30% below its sell trigger value of 1.30. If we bring up a chart of how the RMAR value has fluctuated during this 5 year silver bull we immediately note two spikes coinciding with the silver price spikes of 2004 and 2006. The silver price is shown in green. 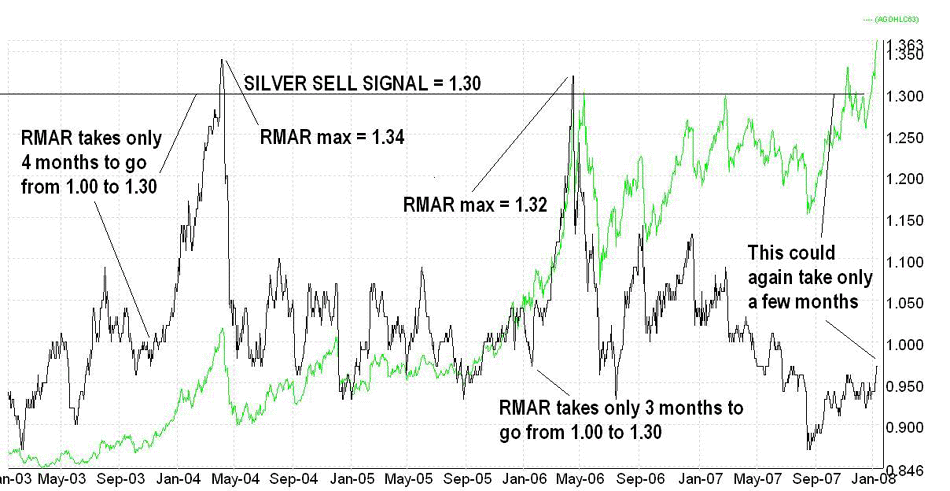 Though the ultimate price of the silver top was not known in advance, this was not required (as if it could be acquired!). When the RMAR reached a value of 1.30, the price run ups were at near exhaustion and ready to collapse within weeks if not days. Timing was of the essence since silver quickly ate up all the gains of the previous months. The performance of the RMAR for the 2004 and 2006 spikes is given below. 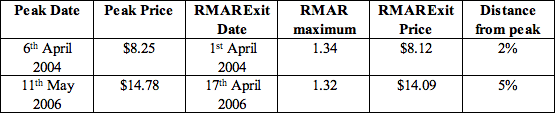 The RMAR for 2006 actually called a sell on the first peak of a silver double top so though taking profits in long positions was the right decision, going short silver at that trigger point needed some caution because a short lived leg up was to follow. Note the requirement for careful management of stop loss positions for such leveraged plays. So with this track record in mind, what can be anticipated for the next few months? Note from the diagram that when silver begins to move, the RMAR begins to move too. In fact, since the value is at about 1.00 just now, we compared how long the 2004 and 2006 RMAR runs took from a launch of 1.00 to a 1.30 sell. The answer was four and three months respectively for 2004 and 2006. So, if the RMAR is going to trigger a sell signal in a similar fashion to previous spikes, we may not anticipate a top in silver until at the earliest May or June. Considering the duration of the previous bull runs, this seems in accord with past data. However, you know the old financial caveat; the past is not always an indicator of the future. We will continue to monitor this indicator (amongst others) for subscribers and begin to marshal silver assets for sale as the sell threshold approaches. Further analysis of silver can be had by going to our silver blog at http://silveranalyst.blogspot.com where readers can obtain a free issue of The Silver Analyst and learn about subscription details. Comments and questions are also invited via email to silveranalysis@yahoo.co.uk. Roland Watson 321gold Ltd |
