|
|||
The Golden Market Melt DownChris Vermeulen Broad Markets on the Brink of Destruction On Monday [Dec 8] the NASDAQ 100, SP500 and Dow all gapped higher with average volume above the recent consolidation levels. This appears to be the same setup we had on November 4th which was an exhaustion gap followed buy heavy selling down to new multi year lows. The chart below is of the SP500 ETF but the QQQQ and DIA all show the same price action. I'm not saying we are headed lower but caution must be taken here incase this play[s] like it did a month ago. 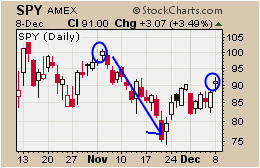 Volatility remains extremely high for equities, and holding cash is the best position at this time. Many traders are trying to pick the bottom and I recommend not playing that game. No one knows when and where a bottom will take place and with current volatility levels, you can lose 10% in one day. Let's not worry about missing the first rally, which will most likely be a sharp couple days straight up, but instead wait for a safe opportunity to put our hard earned money to work and continue to add to positions, as we get corrections. Gold & Silver Outlook Gold & Silver's Long
Term View Gold Miner's Index 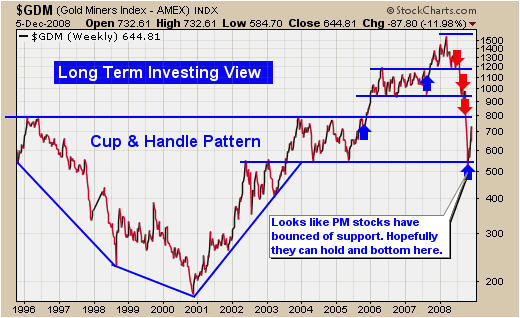 The Gold Bugs Index is a great
indicator and generally I find it leads the price of gold for
up to 4 days on the daily chart and up to 2 months on the monthly
chart in some situations. The monthly chart of the HUI shows
a very clear picture, as to where we stand for gold and gold
equities. Again we have had a solid bounce off support, but what
we really want to see here is the HUI to continue climbing faster
than the price of gold, which will help confirm the bottom for
gold prices. It is important to note that bear markets tend to
pull all stocks down with it, which is why the ratio between
the price of gold and gold stocks is so extreme. As sellers force
stocks down in fear of losing more money, investors are slowly
buying gold, as it is generally a safe haven during times like
these providing some support for gold. 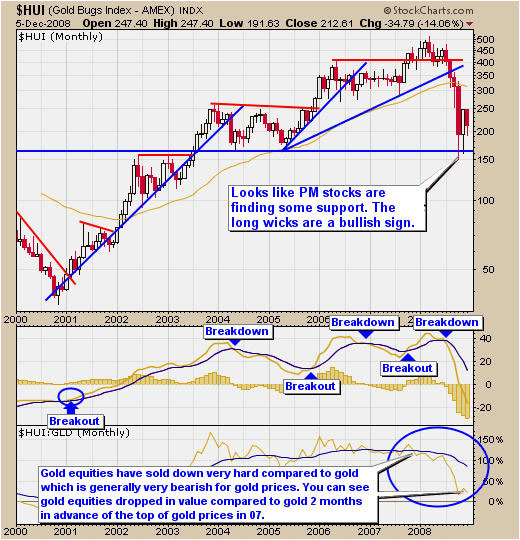 Gold & Silver's Short
Term View Gold Bugs Index - Daily Chart 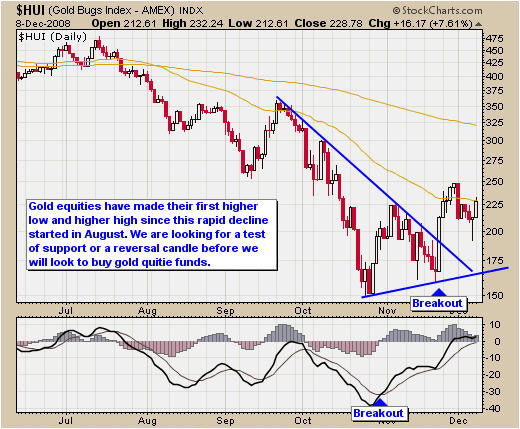 Short Term Gold Prices Gold Prices - GLD Gold Exchange Traded Fund - Daily Chart 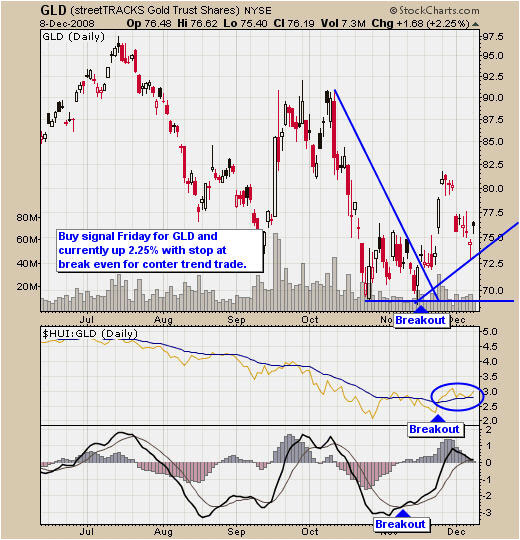 Gold Equities ETF - GDX
Market Vectors Gold Miners GDX Exchange Traded Fund - Daily Chart 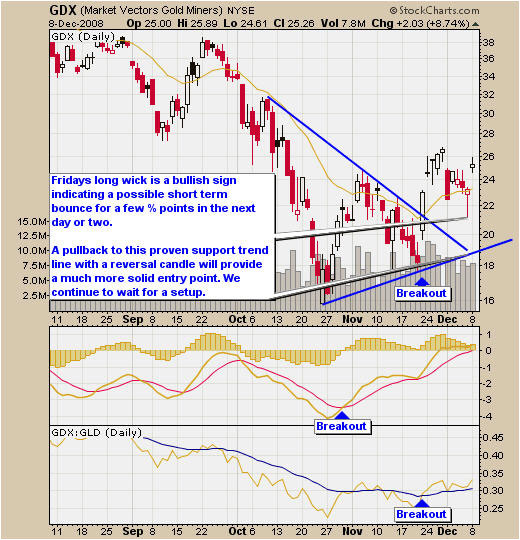 Silver - The Unpopular &
Undervalued Metal Silver's Long Term View 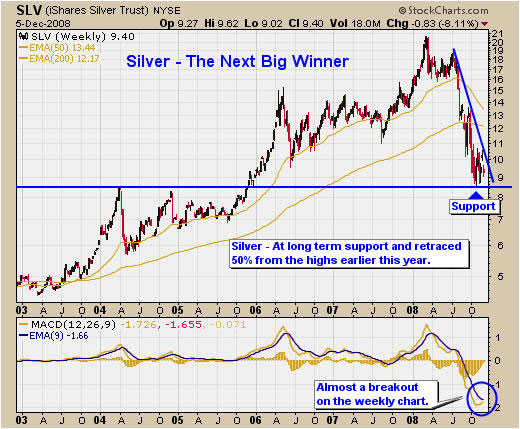 Silver's Short Term View SLV Exchange Traded Fund - Daily Chart 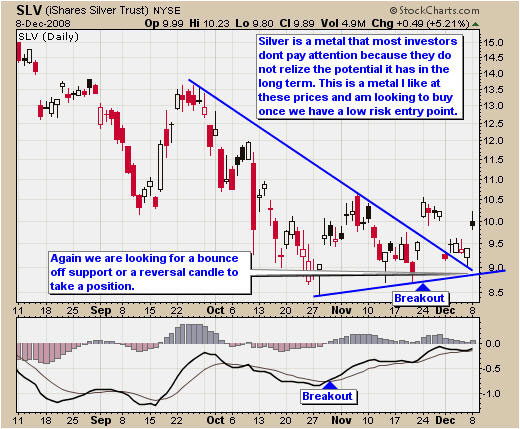 Gold and Silver Summary: Gold and silver metals and equities are showing signs of a bottom and possible entry points for our money to be put to work for a counter trend trade. Most commodities and equities are at levels which are very important to hold, and if these current prices do not hold up, we may see another substantial drop in almost every investment vehicle from commodities, equities, real estate and possibly the US dollar. I would expect gold to hold its value the most, if the broad markets crack and continue their death spiral lower. My main concern is that people will start to sell all their investments like gold and silver because they will need money to cover living and credit expenses. If this starts to happen, gold may not hold its value either. That being said, we can short gold, silver and the markets so it's not that big of an issue in that respect. Also the markets are looking fairly strong as of Friday and a bottom may have been put in already. If we do get these setups you SHOULD invest in BOTH gold and silver, as a powerful diversification strategy. There certainly have been times when gold prices have held up better than silver and vice-versa. Hold both precious metals and you iron out some of the fluctuations inherent in the market while maximizing your returns. ### Dec 9, 2008 Chris Vermeulen is founder of the popular trading site TheGoldAndOilGuy.com. There he shares his highly successful, low-risk trading method. For 6 years Chris has been a leader in teaching others to skillfully trade in gold, oil, and silver in both bull and bear markets. Subscribers to his service depend on Chris' uniquely consistent investment opportunities that carry exceptionally low risk and high return. Subscription
Service: You can sign up here. This article is intended solely for information purposes. The opinions are those of the author only. Please conduct further research and consult your financial advisor before making any investment/trading decision. No responsibility can be accepted for losses that may result as a consequence of trading on the basis of this analysis. 321gold Ltd |

 website: