The Technical Traders
Metals Moving In Unison For A Massive Price Advance : Part I Chris Vermeulen
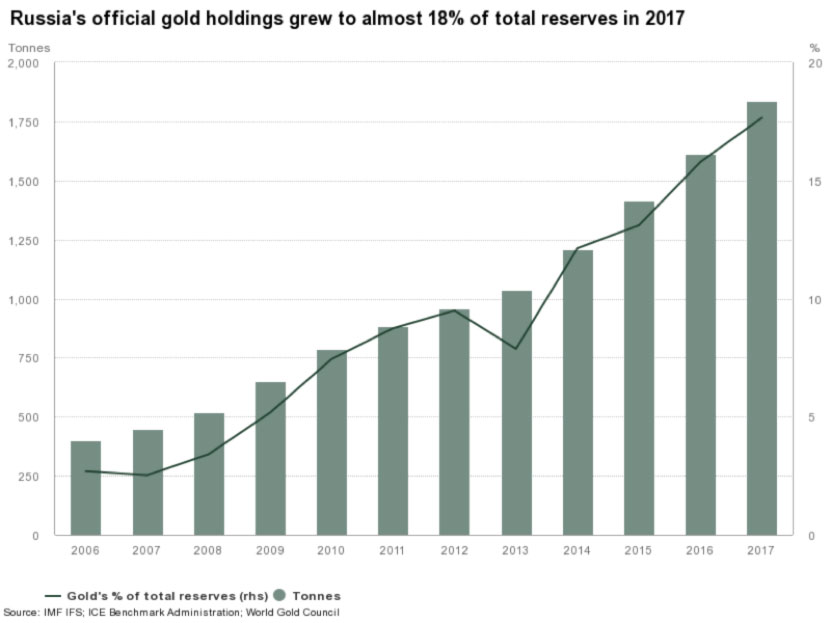
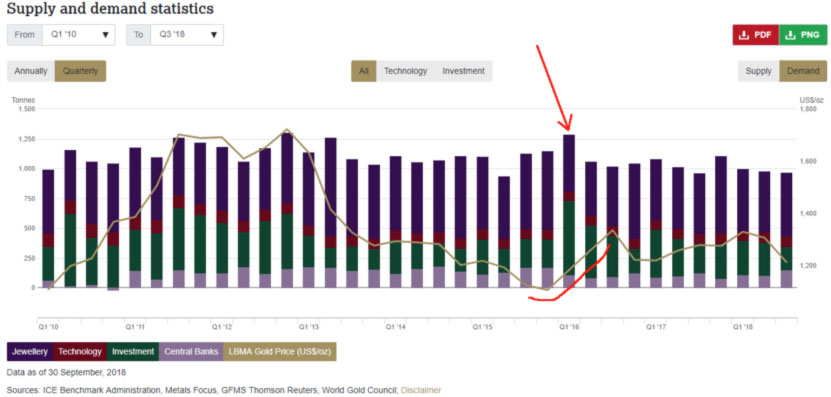
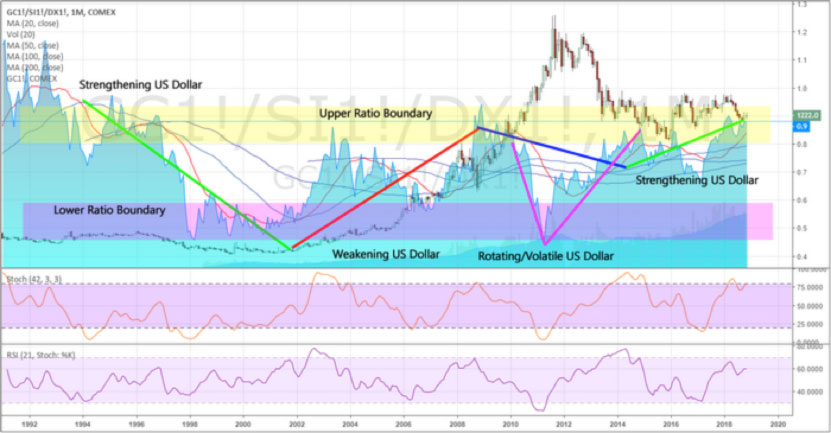
Posted Nov 21, 2018 Are the metals markets ending a price correction in unison and preparing for a massive price advance? This is the question we asked our research team to investigate and their findings may help skilled traders identify great opportunities in the future. This multi-part research article will share our most recent opinion about the metals markets as well as share some critical new data that can shed some light into what we believe will become a massive upside price rally in the metals markets. Let's get into the data. When one considers the global demand for Gold as a hedge against economic crisis events and the continued advancement in gold reserves for China and Russia, one has to consider the supply side issues that are a result of central banks global demand. Even though global production of Gold is near an all-time high, the demand from foreign nations and central banks are also near all-time highs. This correlation creates a demand-side consumption that offsets supply and, in some ways limits, consumer, retail and technology suppliers. Our researchers focused on this aspect of the supply/demand equation when trying to analyze recent metals price action in correlation to disruptions that could occur in the markets. For example, increased central bank buying/hoarding of gold could dramatically result in prices spiking. Foreign market disruptions in supply could also send prices spiking. Global conflicts and or continued trade issues could send metals prices skyrocketing. Anything to do with the supply side for Gold could send prices higher. At least this is the conclusion of our research team at this time. Russia has continued to build its gold reserves throughout the past 10+ years. Should Russia and other nations continue to absorb supply at these levels, one could easily argue that price declines in the metals markets are unusual. (Click on images to enlarge)  Demand for gold is varied and includes Jewelry, Technology, Investment, and Central Banks. We can see from this data that Jewelry and Investment make up nearly 65~70% of total demand every quarter. Jewelry, in many nations, is a secondary form of investment for many people. Unlike in the US, gold is typically sold at 22K levels in much of Asia and at 24K levels throughout much of the Arab world. Individuals can purchase these high-quality jewelry items not only to wear but also as a capital investment. People in these countries are able to resell this high-quality gold to jewelers and others at near spot price whenever they need extra cash. We can see from the chart, below, that demand is moderately weaker over the past 2 years, but still near all-time highs. Consider, for a moment, what a moderate supply-side disruption or pricing advance would do to the demand side of these levels? Take a look at the increase in Investment demand in 2010 through 2012 in relation to today. Also, pay attention to the huge Investment increase in demand in Q1 of 2016 and the correlative price advance that occurred as demand shot higher. One key factor for price advance is that Investment demand increases dramatically as a driving force for price increases. Because of this, we would watch for investment demand to increase dramatically over the next 4~6+ months which would indicate that a continued price advancement is expected.  Our researchers dug further into price history with a dynamic new tool that allows us to measure and gauge price rotation in comparison to a number of key factors. The purpose of this exercise was to identify the price and relationship boundaries of Gold, Silver and the US Dollar as these price variances correlate to the price advance and decline of Gold. Our hope was that we would identify some very important new aspect to the relationships of these markets as related to the future movement of the metals markets. Our researchers focused on these key relationship and found the following. This first chart highlighting our custom Gold/Silver/US Dollar ratio (the blue area chart) in comparison to the historical price of Gold is actually very interesting. First, we highlighted the general trend direction of the US Dollar – showing Strengthening, Weakening and Rotating trends. Next, we highlighted the Upper and Lower boundaries of our custom price ratio to highlight key areas where the ratio changed direction or where prices initiated new or reversed price trends. It is fairly easy to see the price of Gold either initiated new trends or changed price trend at or near these Upper and Lower boundary levels. It is also fairly easy to see the huge price advancement between 2004 and 2011 occurred within a Weak and Rotating US Dollar environment. Additionally, within this same time span, we were able to witness multiple boundary rotations and different Gold price activity types as the US Dollar shifted from a downward price trend to a very volatile/rotating price trend (2009~2015). In all reality, the biggest Gold price rally and decline happened between 2009~2015 at a time when the US Dollar was rotating and at a time when the global markets were experiencing a massive credit/market event; including much of the subsequent market recovery event. The massive ratio trough occurred in April 2011; at a time when the US Dollar reached a fresh new low and when the US stock markets were recovering quite well.  Taking a look at the most recent 4~5 years on this chart, two critical items came to our attention; first, the lows reached in 2015 and the recent lows in 2018 both occurred while the custom ratio levels were within the Upper Boundary area. We have not seen the ratio move into the Lower Boundary since 2011. What causes the ratio to move toward this level and what are the correlations that we can ascertain from further research using this new tool? Could this new tool provide any real insight into the future price of Gold, Silver, and other metals? We'll continue our research in the second part of this article to show you why we believe the metals markets are set for a massive price rally and why we believe this one will be completely different than anything we've seen in the past 20 years. We believe you won't find a better team of researchers, traders and analysts than with www.TheTechnicalTraders.com. Our proprietary research, price modeling systems, and predictive analysis tools help to keep our members well ahead of the market with each turn. ### Chris Vermeulen
email: chris@thetechnicaltraders.com
website: www.thetechnicaltraders.com Disclaimer: This material should not be considered investment advice. Technical Traders Ltd. and its staff are not registered investment advisors. Under no circumstances should any content from this website, articles, videos, seminars or emails from Technical Traders Ltd. or its affiliates be used or interpreted as a recommendation to buy or sell any type of security or commodity contract. Our advice is not tailored to the needs of any subscriber we advise that you talk with your investment advisor before making trading decisions. This information is for educational purposes only. 321gold Ltd

|