|
|||
Gold & Silver Technical Trading ChartsChris Vermeulen I hope everyone enjoyed the weekend. Gold is once again the hot commodity, as the price rises to the $1000 per ounce level. This $1000 - $1033 is a technical pivot point for gold. One of two things is going to take place in the coming weeks. If the price of gold can move above $1033 then I expect to see a lot of traders and investors buying gold, as they panic into the position because they do not want to miss another gold rally. Also traders who are short gold will be forced to cover their positions and this will send the price of gold rocketing higher towards the $1200- $1500 area. On the other hand, if gold fails to break higher, we will see a swift sell off, as everyone sells their position. HUI - Gold Stocks Index - Monthly I like to use this chart for timing longer-term gold investments. Gold stocks tend to lead the price of gold on a percentage gain/loss basis and so far this month, gold stocks are on fire. This bodes well for gold. When I see breakouts on this monthly chart, I tend to take larger positions in gold and gold stocks because rallies tend to last 2-6 months. I like to take profits, as the price rises, so that I am locking in gains while still taking part in the continuing move. The gold stocks (Golden Rockets) we purchased 2 months ago are now up 45% and 100% from our entry point and they still look very strong. Taking some money off the table is a great idea. Gold could go either way fast and it's better to sell some of the position to lock in profits and let the balance of the trade run. Too many traders swing for a home run and never take profits on winning positions. Winners eventually turn into losers if you hold on to them long enough. Money management is the key to successful trades. 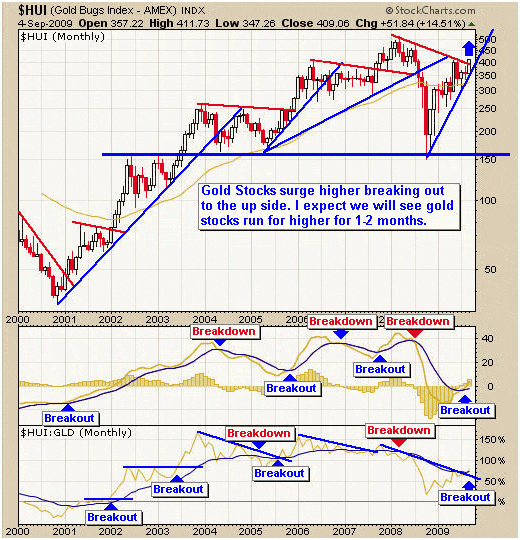 Price of Gold - Gold Bullion - Weekly Chart This chart clearly shows the breakout last week from the pennant pattern. The price of gold is nearing resistance. This week will be exciting as gold tries to breakout. 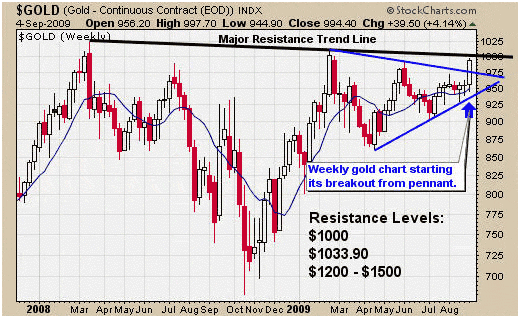 Price of Silver - Silver Bullion - Weekly Chart Silver is not as close to the 2008 high like gold is, but is still performing well. Silver is trading at a short-term resistance level and I expect to see higher prices this week. 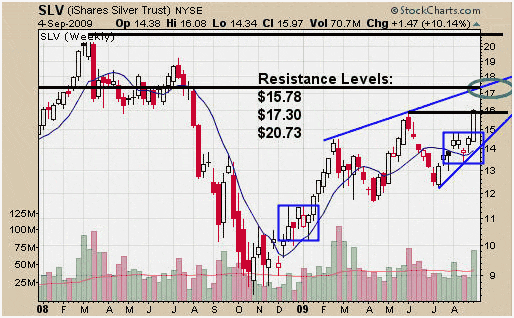 Silver and Gold Newsletter Conclusion: Gold and silver are starting to run higher and with all the media coverage I expect to see money moving into precious metals for a couple months. This is an exciting time for precious metals investors and a lot of money is going to be changing hands once these metals pick a direction and start moving. ### Chris Vermeulen Chris Vermeulen is founder of the popular trading site TheGoldAndOilGuy.com. There he shares his highly successful, low-risk trading method. For 6 years Chris has been a leader in teaching others to skillfully trade in gold, oil, and silver in both bull and bear markets. Subscribers to his service depend on Chris' uniquely consistent investment opportunities that carry exceptionally low risk and high return. Subscription
Service: You can sign up here. This article is intended solely for information purposes. The opinions are those of the author only. Please conduct further research and consult your financial advisor before making any investment/trading decision. No responsibility can be accepted for losses that may result as a consequence of trading on the basis of this analysis. 321gold Ltd |

 website: