The Technical Traders
Stock Market Breaks Out of Bullish Chart Pattern Chris Vermeulen
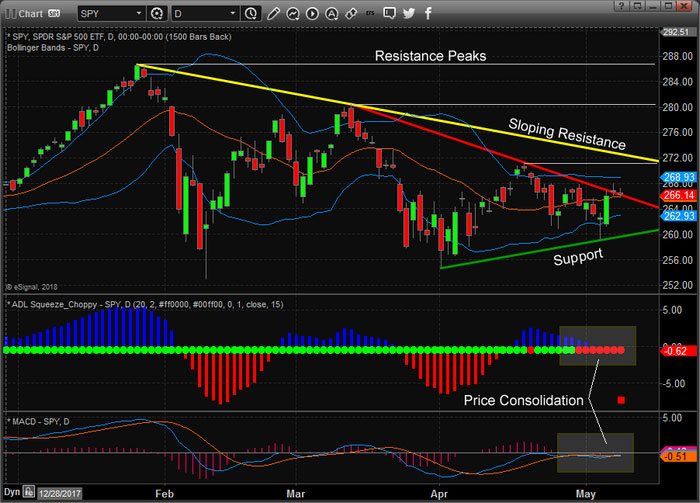
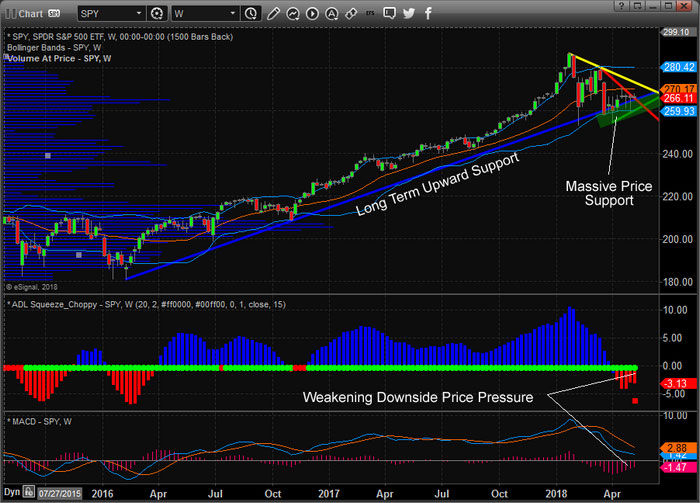
Posted May 10, 2018 Since before the start of 2018, we have been relying on our advanced predictive modeling systems, technical analysis and our understanding of the capital markets to help our members take advantage of the incredible price swings in 2018. These charts presented below of the SPY and Transportation index should help to clear up any confusion with direction and potential in the markets for most of you. Far too many people have been concerned with the global markets while thinking these concerns could negatively result in the US markets contracting. Our opinion is a bit different than many other analysts. We believe capital will come rushing into the US markets if weakness or concern continues in foreign/emerging markets. We think these concerns will spark a “capital migration” into the US where it is likely that Equities and Commodities continue to rally as many foreign markets continue to weaken. Capital (CASH) is always searching for the best returns and will source the safest locations for ROI. Take a look at this Daily SPY chart. It clearly shows the sloping resistance and support channels that are containing price over the past few months. Additionally, above the current price, you can see horizontal PEAK resistance levels that should be considered upside targets and DUAL resistance levels (Red & Yellow) that are currently holding price from rallying upward. If you take a look at the lower indicators (ADL Squeeze and the MACD), you will see that price is very narrowly congested while recent support is evident with “higher low points” in price. (Click on images to enlarge) 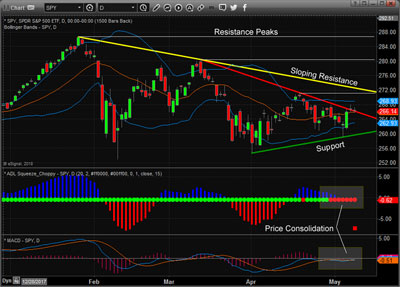 A broader look at the SPY Weekly chart shows a similar perspective over the past three months of price action, yet we can see the Long-Term Upward Support channel as well as the Massive Price Support “block” that is near the right side of the chart. Again, the lower indicators are showing a weakening bearish price trend that coincides with technical price patterns illustrating price support is holding up well. The only thing holding this market back right now is the US Dollar and fear that any global market crisis could hinder the upside potential. Think about it, the US economy is still fairly strong, and unless something derails it in a massive form, we don't believe the downside risks are a concern at the moment. We believe that global capital will be moving into the US equity market faster than ever as a gradual weakness takes hold of many foreign and emerging markets. We believe the upside potential at this point in the market is the most likely outcome and we are trying to illustrate how we believe the markets will react over the next few weeks. 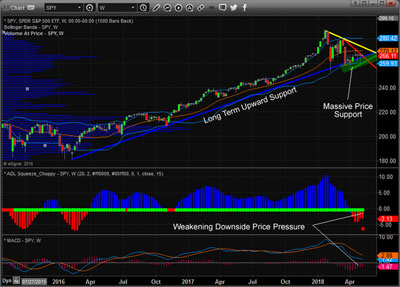 Lastly, let's take a look at the Weekly Transportation Index. The fact is that all of these charts are similar in structure and form. It is almost like the markets are screaming at us and telling us what will happen next. So many analysts are still fearful of downside pressures and predicting a top formation that will prompt a downside move. We believe the support levels we are showing on our chart would have to become threatened or breached before any downside move potential has any real chance. We also believe that price has been telling us that an upside reversal pattern within this extended Pennant/Flag is setting up. Yes, there was a reason for some concern back in February, when the market volatility skyrocketed, and the initial price drop frightened pretty much everyone. But we believe that the recent price patterns, support, indicators and our advanced predictive modeling systems have shown us a different picture completely from what most individuals are thinking. We don't believe the markets have much downside potential at this point and we have identified multiple unique trading opportunities to take advantage of the future price swings. 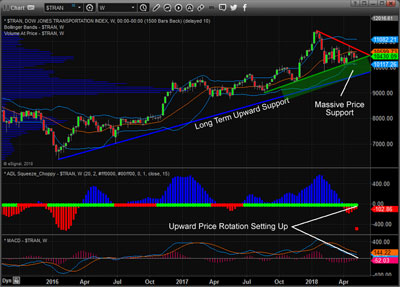 If only you knew what our Fibonacci and cycles predictive modeling systems were telling us for the hot sectors, gold, silver, oil and natural gas you would be just as excited as we are about these pending selloffs and rallies starting to unfold. The good news is that we’ve tried to give you a hint in regards to what our advanced technology is showing us for the US indexes and we want to remind you that we called this market bottom (cycle low) over three weeks ago. As long as these support levels hold and nothing dramatic derails the US economy and expectations, we believe the opportunity is for an upside price breakout that may drive prices to new all-time highs. To learn more about our trading analysis for stocks, ETF’s, and futures visit www.TheTechnicalTraders.com to see how we can help you stay ahead of the markets. ### Chris Vermeulen
email: chris@thetechnicaltraders.com
website: www.thetechnicaltraders.com Disclaimer: This material should not be considered investment advice. Technical Traders Ltd. and its staff are not registered investment advisors. Under no circumstances should any content from this website, articles, videos, seminars or emails from Technical Traders Ltd. or its affiliates be used or interpreted as a recommendation to buy or sell any type of security or commodity contract. Our advice is not tailored to the needs of any subscriber we advise that you talk with your investment advisor before making trading decisions. This information is for educational purposes only. 321gold Ltd

|