|
|||
Traders' Report on Gold & SilverChris Vermeulen The past few days have been stressful as I watched gold slowly work its way higher without a decent correction to take another position. Both gold and silver have been on a tear moving higher not allowing the more conservative trader like myself with a low risk setup and entry point. I am not a fan of chasing prices higher as it generally leads to a quick loss when prices snap back and correct from a overbought state. This is what both gold and silver did today and I expect to see lower prices over the next week or so depending on how fast they correct. Last Friday I mentioned the open interest on gold went down sharply which told me that smart money was moving out of gold and that is always a RED FLAG. Let's take a look at the charts below because that's what trading is all about Price Action. HUI Gold Bugs Chart - Monthly Long Term Trading 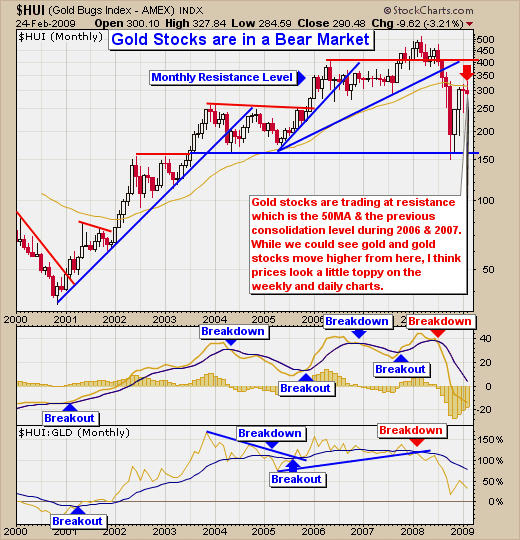 The monthly chart of the gold equities index shows a simple and clear picture. -Bounced to the 50 period moving
average (Resistance/Profit Taking Zone) Gold Equities from an Active Traders Point of View - HUI Daily Chart 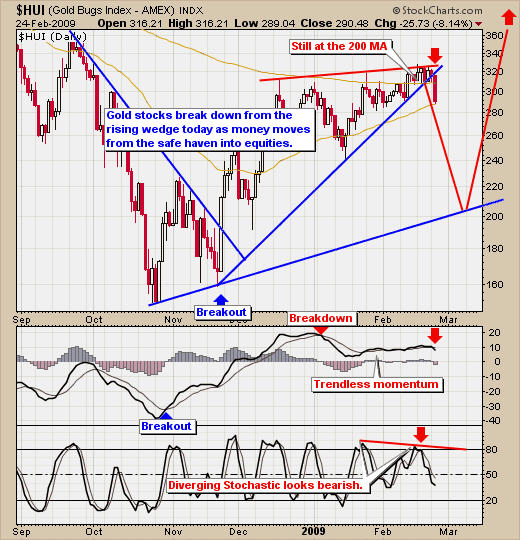 Gold stocks had a very clean breakdown today from an ascending bull wedge. This is a great trade for highly speculative traders who want to catch a quick short trade. Today's big move warrants an update tomorrow for gold stocks which could provide a better entry point before prices continue to come in (decline in price). The reason I say this is highly speculative trade is because gold and gold stocks have been very strong and prices may just continue sideways as they coil up for another move higher. Always have protective stops in place. -Break down from wedge (Bearish) Active Traders View on Trading the GLD Gold Fund - Daily Chart 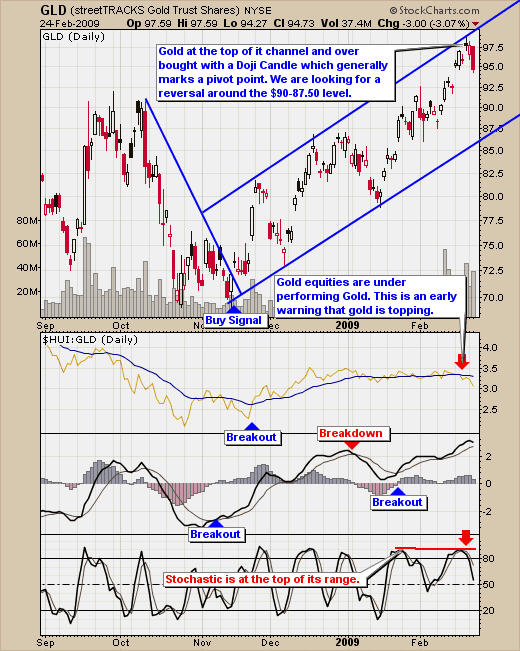 Gold has been over bought since it reached $90 several weeks ago at which point I was expecting a pullback to provide an entry point but then more bad news hit the wire sending another surge of gold buyers into the market pushing it higher with out correcting. -Gold is at the top of it trading
channel (Bearish) SLV Silver Weekly Chart - Trading Chart 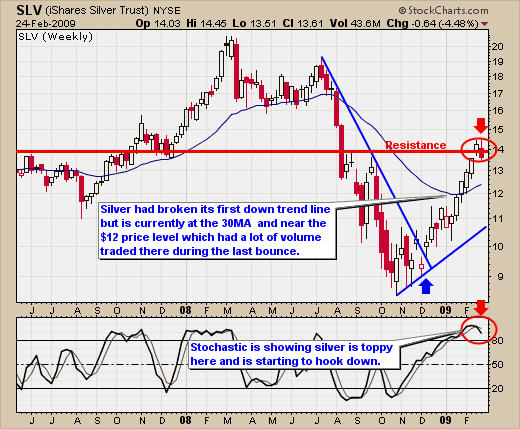 The weekly chart shows as speculative trade for shorting silver which could correct back to the $11.50 - $12 range in the next couple weeks. -Silver at long term resistance
(Bearish) SLV Silver's Active Trader Point of View - Daily Chart 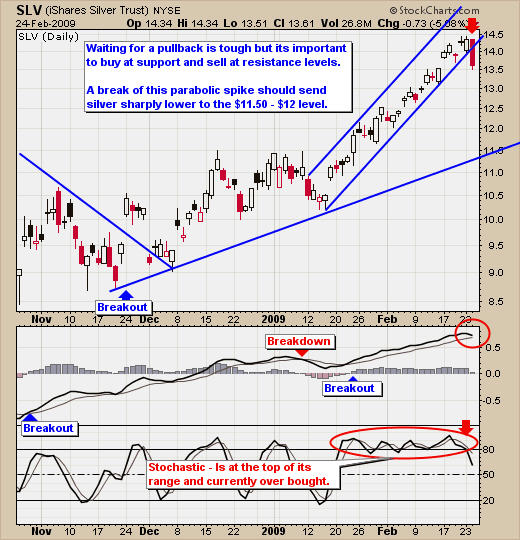 Silver has really performed well this year forming a mini parabolic spike which generally leads to a sharp bank breaking correction which silver is known for. -Silver broke down from rising
parabolic channel (Bearish) Gold, Silver Trading Conclusion Gold and silver are looking toppy and ready for a correction. The charts above show where things should be headed over the next few weeks. I am bullish on gold long term but I don't think it's going to be as good as many are expecting. I have been watching the price action closely and if we do get a bottom soon in the markets I think we are going to see money coming out of gold and silver and into the broad market where there is are huge opportunities floating around. Feb 24, 2009 Chris Vermeulen is founder of the popular trading site TheGoldAndOilGuy.com. There he shares his highly successful, low-risk trading method. For 6 years Chris has been a leader in teaching others to skillfully trade in gold, oil, and silver in both bull and bear markets. Subscribers to his service depend on Chris' uniquely consistent investment opportunities that carry exceptionally low risk and high return. Subscription
Service: You can sign up here. This article is intended solely for information purposes. The opinions are those of the author only. Please conduct further research and consult your financial advisor before making any investment/trading decision. No responsibility can be accepted for losses that may result as a consequence of trading on the basis of this analysis. 321gold Ltd |

 website: