 Graceland Updates 4am-7am Graceland Updates 4am-7am
Beam Me Up Scotty. To Gold
$1700
Stewart Thomson
email: s2p3t4@sympatico.ca
Dec 30, 2008
- The CFTC's COT gold report
is out. The funds continue their price chasing frenzy to get
on board "the big one". Last week's report showed the
funds bailed on 4,000 failed shorts and added 25,000 longs. Yesterday's
report showed they added 8,000 longs and bailed on another 3,000
shorts. Meantime the bankers continue to build their shorts in
gold following a $200 upmove in the gold price. Last week's report
showed the bankers piling on 30,000 shorts. This week the bankers
added another 10,000.
- Earth to the fund industry:
"Knock knock on your collective coconut head.anyone home?
If you chased price 1000 times and got burned 90% of the time,
isn't the lesson: Don't Chase Price? 40,000 shorts piled on in
2 weeks by the bankers and you are loading up on gold in yet
another price chasing frenzy?" Maybe it is a great time
to buy vast amounts of gold, after a $200 upmove. And buy it
from the guys who bought it at $680-800, who bought it deep in
the pain zone.
- Here's the amount of money
I'm willing to spend to buy gold here: one cent.
- As you will see later in this
article, the medium term picture for gold may be about to turn
shockingly bullish with the upside target quantifiable. Having
said that, the COT report clearly shows that if you are piling
on gold longs here, you are betting directly against Mr. and
Mrs. Bank Owner. Who are piling on bets it will tank. How quickly
the memories of gold at 680 and gold stocks down 70-90% fade
away. Bitter memories replaced by price chased (pipe)dreams of
gold $1500, gold $2000 and higher.
- Stayed focused. Get lean and
mean. Prepare yourself for battle. Are you prepared to buy gold
into the next $100 sell-off, whenever it comes? I hope so. Because
it is a reality that will happen. How about the next $200 sell-off?
Are you prepared? Subscribers know my prediction for gold is
$6500. And know predicting gold's final price target is a completely
separate exercise from making money in gold. Yesterday was another
good day on the gold hockey rink for us. Lots of pucks going
into the net. Sell into strength. Buy into weakness.
- It isn't that hard to make
money in gold. Here's the secret: If you get up in the morning
and gold is up, you are a seller. That is your job for the day
as long as gold is up. To be a gold seller. To take some money
off the risk table, off your risk table. If you get up and gold
is down, your sole gold job is to be a buyer of gold.
- Charts, earnings, mine reports,
tips. All these are tactics and tools to help you do your job.
Buy weakness. Sell strength. If you try to do some "other
job" in the gold market there is only one outcome: failure.
The average return of minus 50-75% on the typical gold portfolio
while the average gold stock has just rallied 50-100%, speaks
volumes about failed tactics.
- Let's leave behind what doesn't
work.
- And look at some winning tactics:
The New York Federal Reserve issued an aprox 65 page report on
the chart pattern known as the "head and shoulders".
And stated that significant profits can be made through its use.
The head and shoulders pattern can take the formation of a top
or a bottom.
- I suggest readers consider
purchasing "Technical
Analysis of Stock Trends" by Edwards and McGee.
Or go to the library and read the section on head and shoulders
patterns.
- Chart patterns are pictures.
Pictures of price. Technical indicators like stochastics, MACD,
trix do what their general name suggests: They indicate.
They indicate whether price might be relatively high or relatively
low. They also give buy and sell signals. What they don't do
is give specific price targets.
- Like technical indicators,
chart patterns give buy signals and indicate whether price may
be high or low too. They also give specific price targets.
For the next wave of price action.
- Having a price target is a
tremendous tool in the trader's toolbox. A head and shoulders
top (H&S top) looks like the name suggests: a human head
and shoulders on the price chart. A H&S bottom is the same
thing, only turned upside down.
- A H&S pattern can indicate
a significant price move is to occur. The target is calculated
with a simple math equation from grade 2 math. Anyone can do
it.
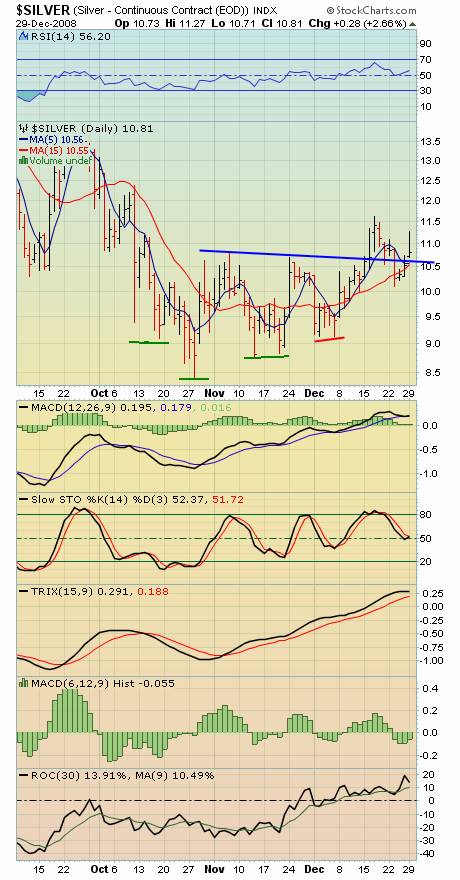
- The silver chart below shows
a potential H&S bottom. The left shoulder is marked with
the green horizontal line, as is the head and the right shoulder.
A 2nd right shoulder is marked with a red line. When a pattern
loses symmetry, it can be a negative warning signal of failure
of the pattern. Thus the red marker. At this point on the silver
chart, it is a very small negative. What all metals investors
should cheer for is for the whole H&S bottom turn out to
be the head of a larger pattern. Whether that happens or not
is unknown.
The strongest patterns morph into what I term "head and
shouldering". Where one H&S bottom becomes the head
of a bigger H&S pattern. That H&S bottom itself may become
the head of a huge H&S bottom on the weekly chart. In rare
cases the "shoulders" themselves are small H&S
patterns. These patterns portend absolutely massive price advances
or declines. A spectacular example of head and shouldering occurred
on the chart of the Dow at the 2002-2003 lows. After melting
to 7300, the Dow produced a huge H&S bottom, with a minimum
target of 10,700. The Dow doubled in price, with the H&S
bottom almost rocket-launching the Dow to the 14,000 level.
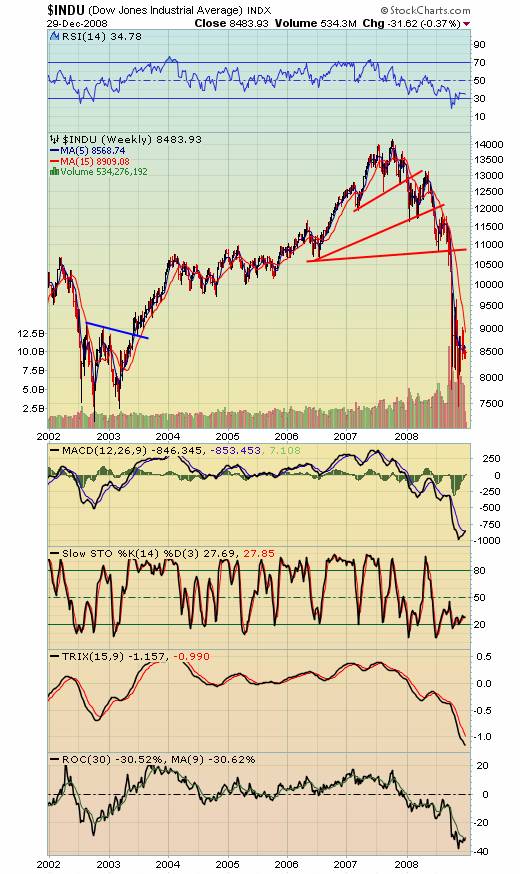
- By January of 2008, a H&S
top formation had ominously appeared in the Dow. As the Dow broke
its "neck" or neckline, it began a process of
head and shouldering. I've drawn in some of the necklines. Using
blue for the neckline on the bottom, red for the top necks. As
you can see, the ramifications of ignoring head and shouldering
action catastrophic. Those who ignored the head and shouldering
action in the Dow received a financial broken neck.
- Common technical chart patterns
include: The Triangle. The Rectangle. The Double Top and
Double Bottom. There are many others, some occurring only very
rarely but with spectacular implications. Like the broadening
top in the Dow in 1929.
- 99% of market technicians
that follow chart patterns, enter their buy and sell orders when
the classic buy and sell signals are given. Sadly, most fail
to generate consistent profits. Their repeated "small stoplosses"
add up to very large overall losses.
- Why? I mentioned the
report on the head and shoulders pattern written by the NY Fed.
- The bankers follow technical
patterns too. Very carefully. They see the orders in the market
placed by the large technical trading funds. A "battle of
the black boxes" goes on. The funds try to hide their buy
and sell patterns from the bankers. Using additional "black
box algorithms" to hide their trading black box algorithms.
- Patterns "fail"
more frequently today than in past years. Frustrating traders.
Some have become so disenchanted they place orders in the opposite
direction given by the chart signal. They don't fare any better.
Because prices often eventually rise to the chart target area
after giving multiple false signals.
- If you want to place your
technical trading "head and shoulders" above the crowd,
you have to use tactics not used by the crowd. If the crowd is
losing money in gold, you will lose money too, if you do what
they do. Regardless of whether gold is eventually going to $6500,
failed tactics mean you may not survive the journey to the pot
of gold.
- What I'm seeing on the gold
chart right now is going to shock you. I see a potential flag
pattern. Not a big one. A MONSTER.
- A flag on a longterm chart
in a major market is an extremely rare occurrence. Some technicians
say it is impossible. I don't believe in the word impossible
in markets. Markets can do anything at any time. They can go
to infinity. Or to zero. The question isn't where they are going.
The question is: Regardless of what happens Are you prepared?
- The target of the flag is
an incredible $1700 an ounce. Basically a doubling of the gold
price from current levels.
- Many gold stocks could rise
by 500% or even 1000% if the flag plays out.
- Ever watch Star Trek? The
Enterprise Space Ship blasting through space. Like gold
blasting to $1700. Was it a smooth ride across the universe for
the Enterprise? No. It was a day to day battle with
many horrible surprises. In the market, surprises are risks.
Risks that need to be managed. Professionally. With the
wrong approach to managing both the risks and rewards that come
with the flag pattern, you may not only miss the ride, but find
yourself at gold $1400 with a gold portfolio in the red!
###
Stewart Thomson
Graceland Updates
website: www.gracelandupdates.com
email for questions: stewart@gracelandupdates.com
email to request the free reports: freereports@galacticupdates.com
Tuesday 14th Jul 2026
Special Offer for 321gold readers: Send an email to freereports@galacticupdates.com and I'll send you my free “Gold & Silver Stocks Launchpad” report. I highlight four key CDNX miners that could surge 50% higher once the CPI and PPI report mayhem is over! Solid investor tactics are included in the report.
|
Graceland
Updates Subscription Service: Note we are privacy oriented. We accept cheques.
And credit cards thru PayPal only on our website. For your protection
we don't see your credit card information. Only PayPal
does.
| Subscribe via major credit cards
at Graceland
Updates
- or make checks payable to: "Stewart Thomson" Mail
to: Stewart Thomson / 1276 Lakeview Drive / Oakville, Ontario
L6H 2M8 / Canada |
Stewart
Thomson
is a retired Merrill Lynch broker. Stewart writes the Graceland
Updates daily between 4am-7am. They are sent out around 8am. The
newsletter is attractively priced and the format is a unique numbered
point form; giving clarity to each point and saving valuable
reading time.
Risks, Disclaimers,
Legal
Stewart
Thomson is no longer an investment advisor. The information provided
by Stewart and Graceland Updates is for general information purposes
only. Before taking any action on any investment, it is imperative
that you consult with multiple properly licensed, experienced
and qualifed investment advisors and get numerous opinions before
taking any action. Your minimum risk on any investment in the
world is 100% loss of all your money. You may be taking
or preparing to take leveraged positions in investments and not
know it, exposing yourself to unlimited risks. This is highly
concerning if you are an investor in any derivatives products.
There is an approx $700 trillion OTC Derivatives Iceberg with
a tiny portion written off officially. The bottom line:
Are
You Prepared?
321gold Ltd

|
