$2010 & $1985: Golden Stocking Stuffers? Stewart Thomson
email: stewart@galacticupdates.com
email: admin@galacticjuniors.com
email: admin@galacticswinger.com
Dec 5, 2023
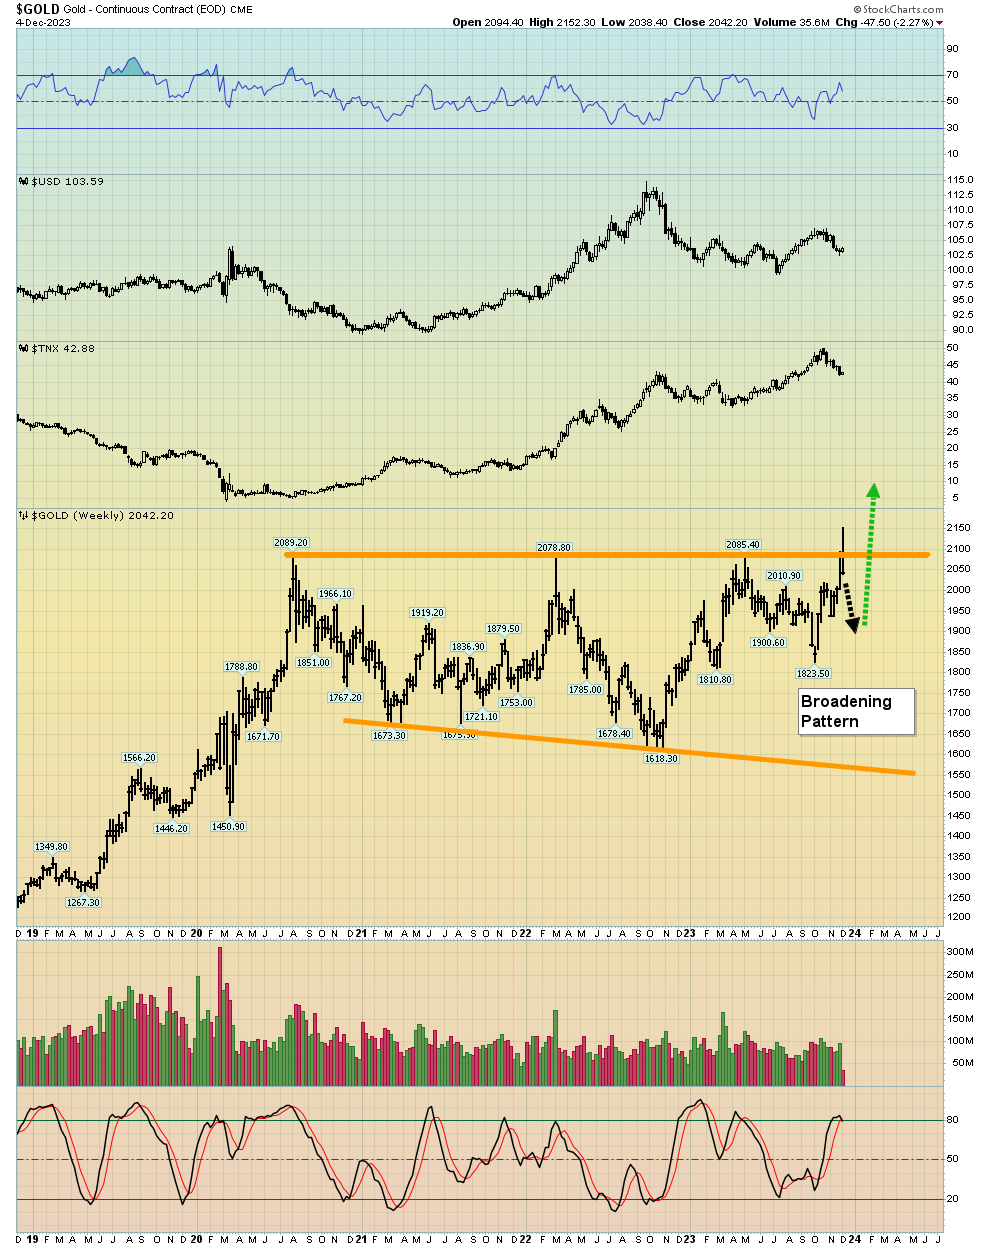
- Please click here now. Double-click to enlarge this key “thrill of victory and agony of very temporary defeat” weekly gold chart.
- Broadening patterns indicate a loss of control in markets. The wild Sunday night and Monday gold price action is “textbook” for the huge broadening pattern in play.
- While Stochastics now has a crossover sell signal, RSI does not. The most likely scenario now is a pause for a week or two, and then another more significant rally to above the immense $2080 “line in the sand”.
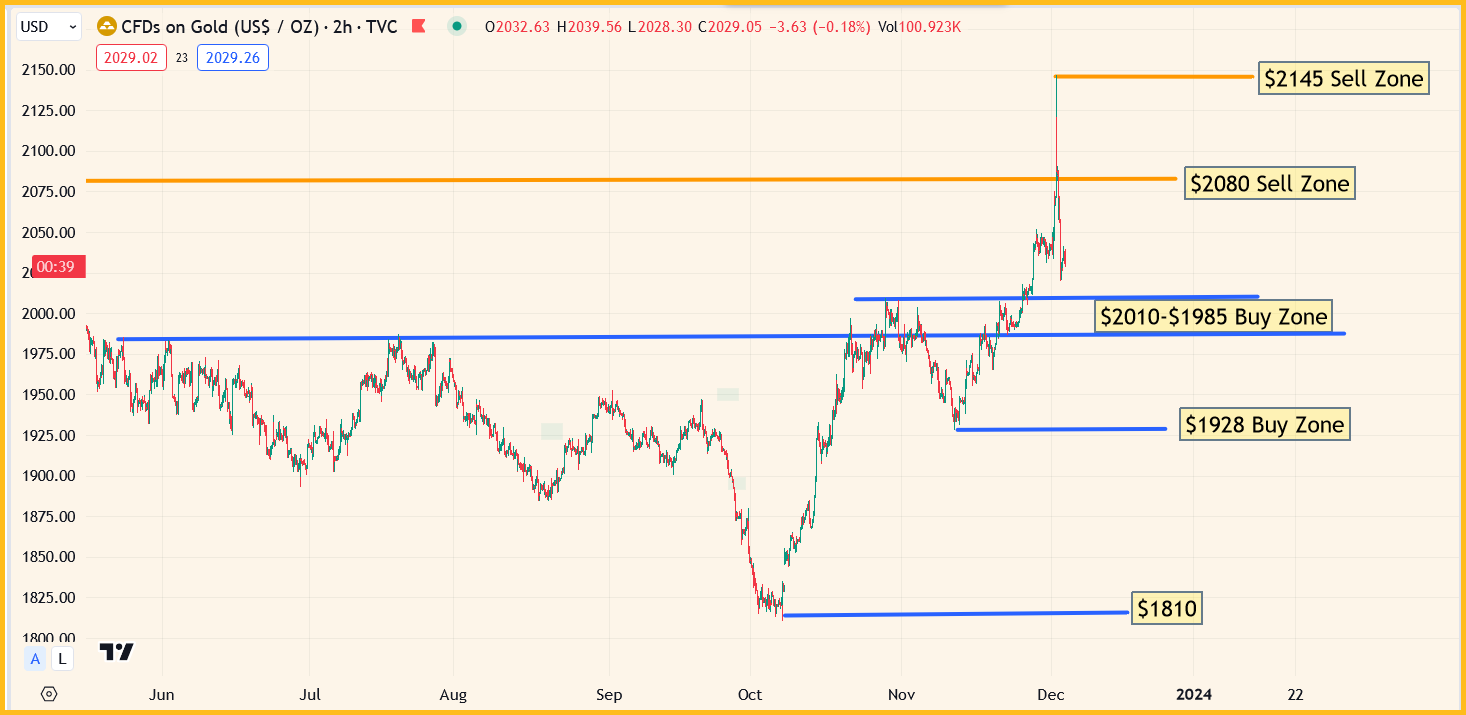
- Tactics? Please click here now. Double-click to enlarge. Gold stock enthusiasts who did some selling into the $2080 gold price area should now focus on buying at $2010, $1985, and $1928.
- These key buy zones should also be the focus for long term accumulators.
- From the $2145 area high, a drop to support at $2010 is a $130/oz price sale. A drop to $1985 support is a $155/oz sale, and the $217/oz drop to $1928 support would be a truly epic price sale… but this last one is unlikely to happen.
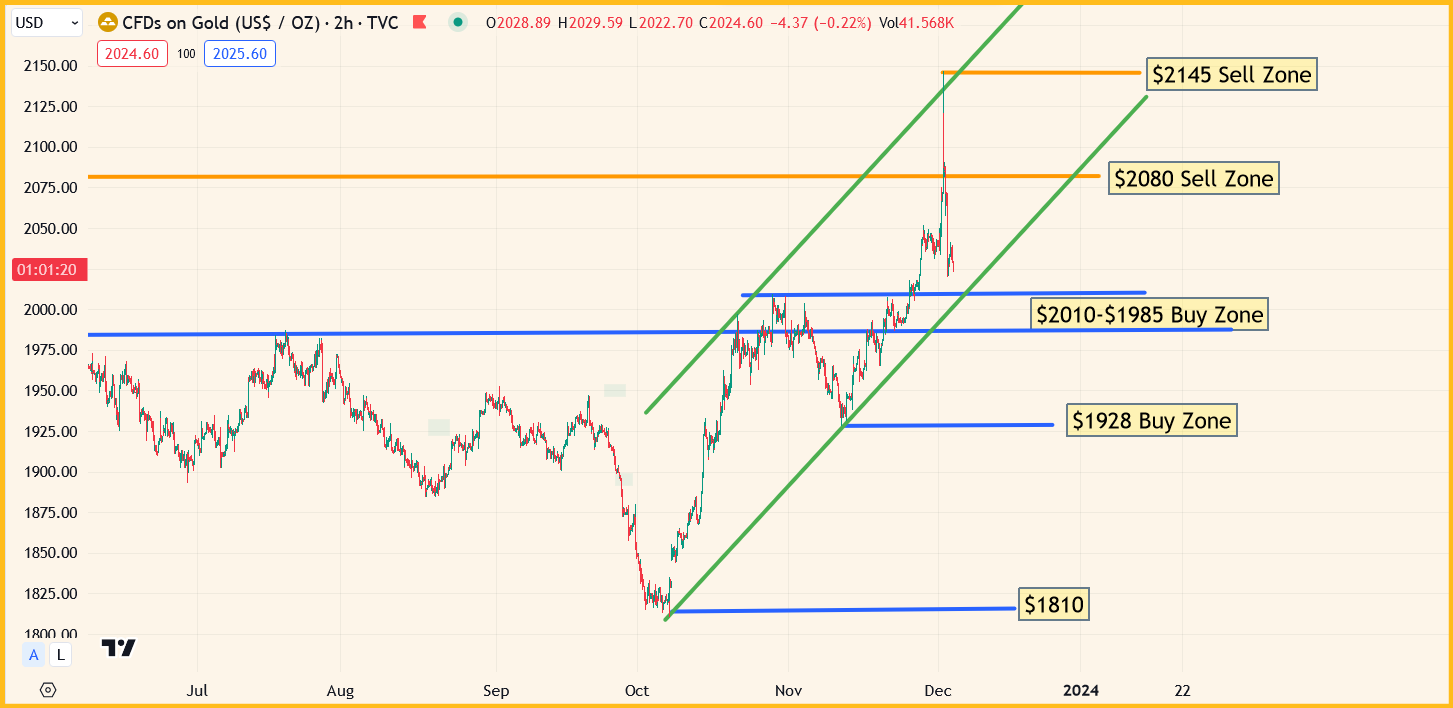
- I’m not a big fan of sloping trendlines in the gold market, but they are helpful at times. On that note, please click here now. Double-click to enlarge, and note the green trendlines defining the volatile uptrend.
- A drop to the lower trendline would put gold at the big $2010-$1985 support area. It’s a “must buy” zone for most gold stock enthusiasts. I call it a golden stocking stuffer… for Christmas 2023!
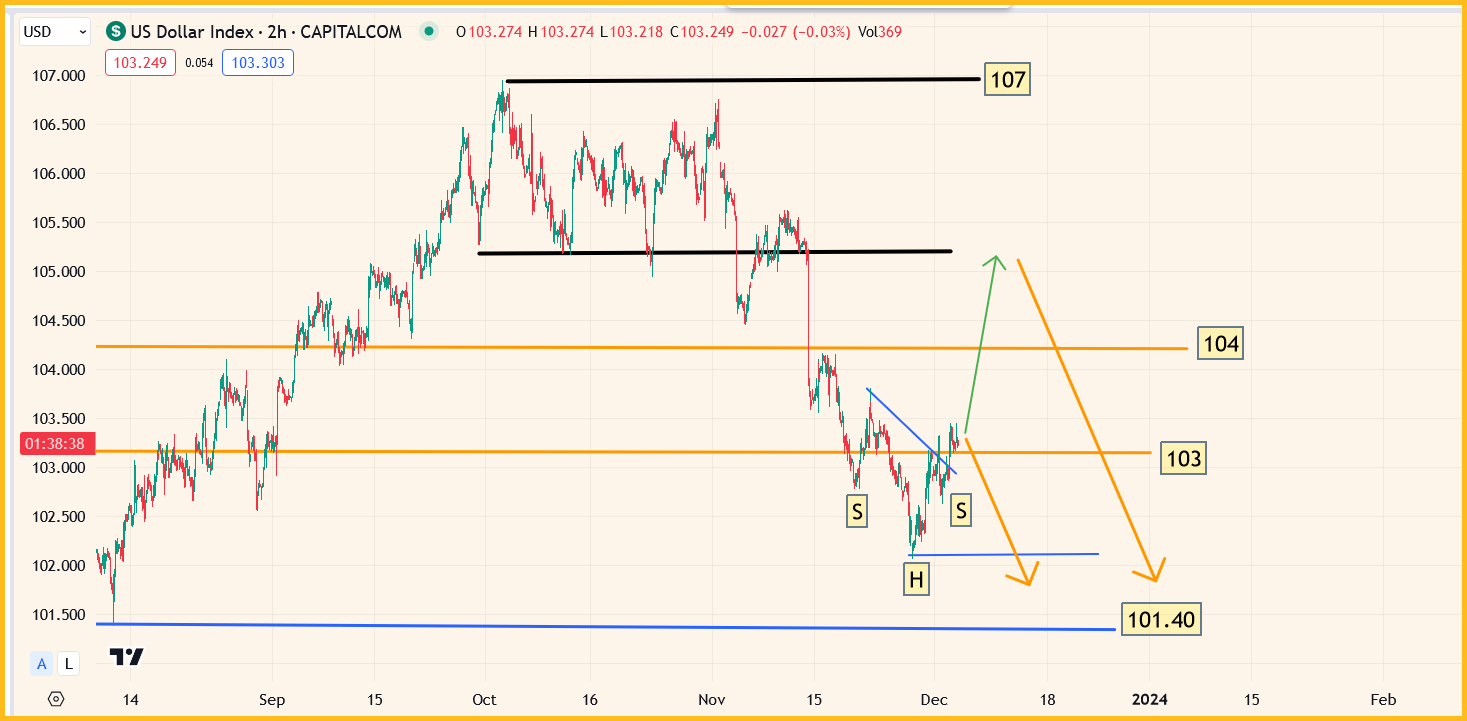
- What about the dollar and rates? Please click here now. Double-click to enlarge this DXY (dollar index) chart. There’s some minor inverse H&S action, and it’s in sync with the projected 1-2 week pause for gold.
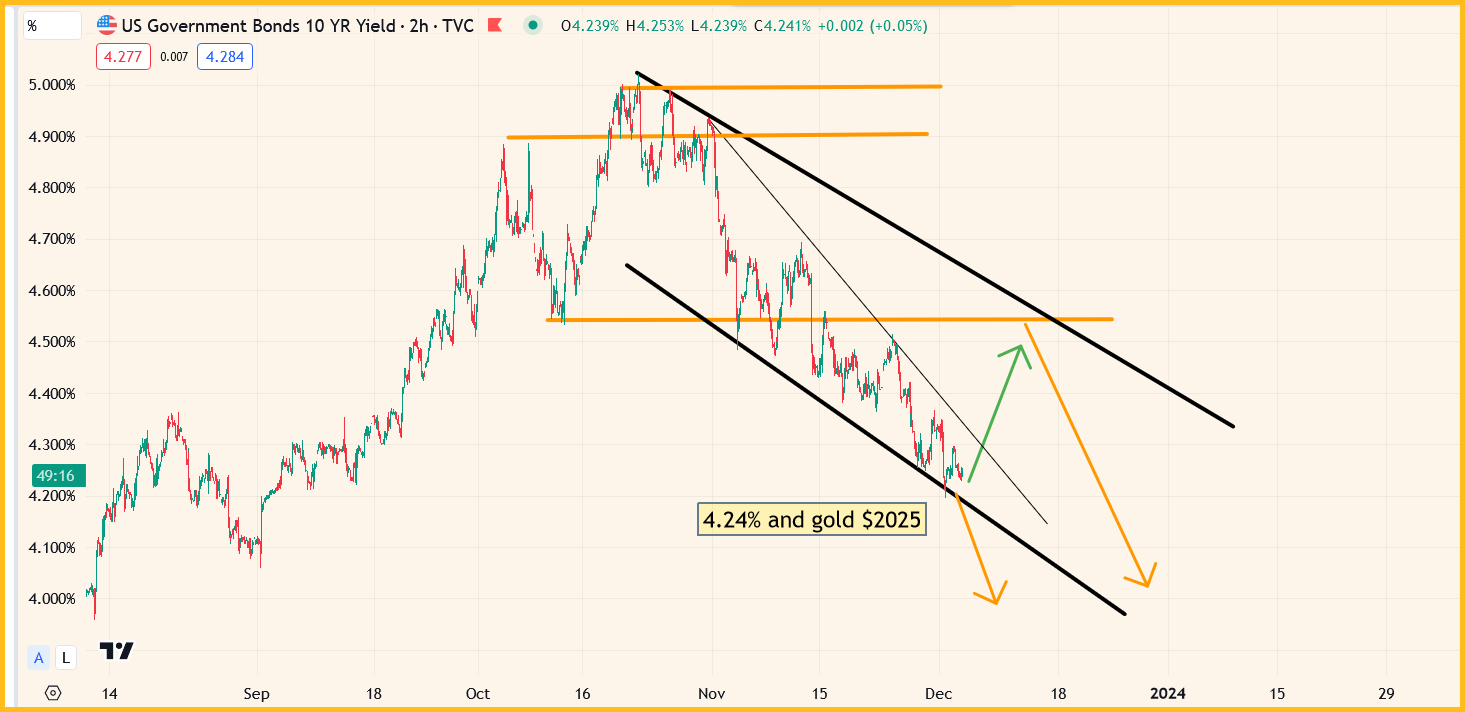
- Please click here now. Double-click to enlarge. US rates aren’t confirming the action in the dollar. There’s a dead cat bounce, but the weekly chart suggests a much bigger dip in rates lies ahead.
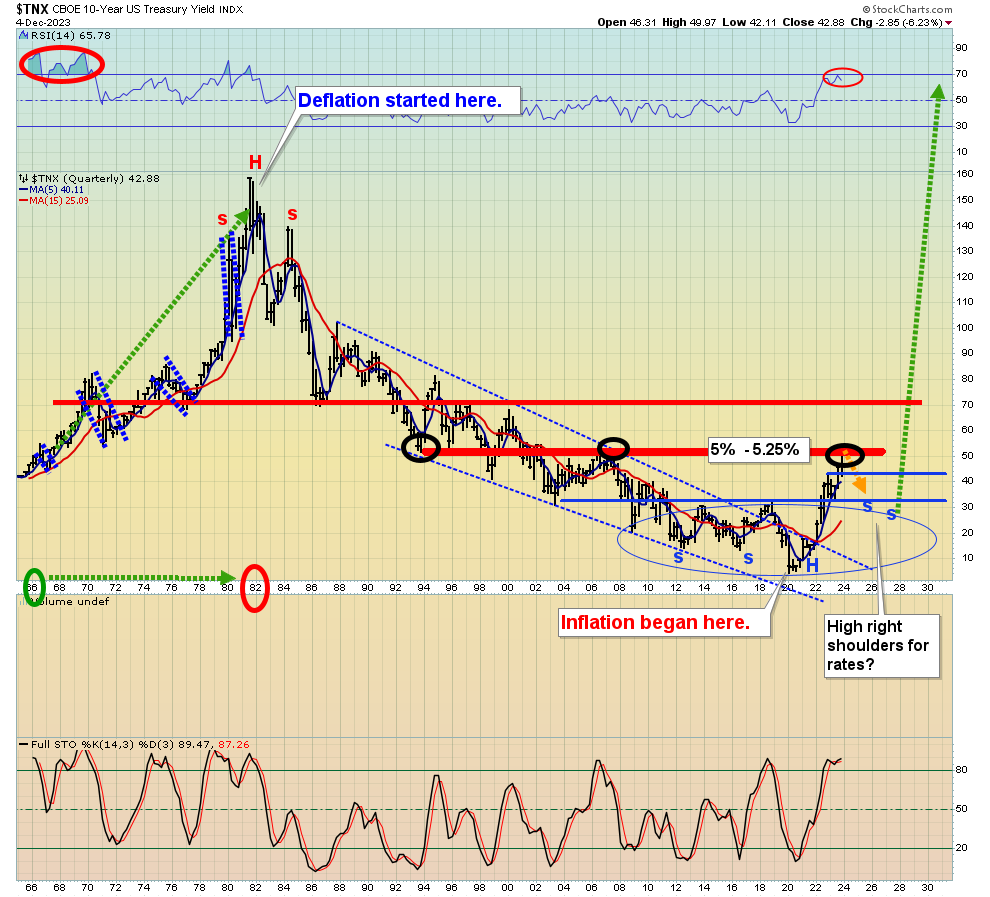
- For a look at that chart, please click here now. Double-click to enlarge. The 5%-5.25% zone is major resistance. Rates need another huge bout of de-dollarization (it’s coming) and inflation (also coming) to move above there.
- In the interim, as the US government bungles the final two years of this 2021-2025 war cycle (like they’ve bungled most of their wars) and the nation ships into recession…
- Rates could dip to as low as 2.5%.
- The bottom line is that 2024 is likely to be a “golden year” for the metals, and it’s possible that rates stay low until 2026 or 2027 before the US government creates the next massive wave of inflation with its drug-like addiction to fiat, meddling, spending, and debt.
- From there, the Fed would start hiking again and gold would take an initial hit… but it would happen from a much higher level than where it is now. How high? Probably $3000+, and at that point, most money managers would have a keen interest in the miners, a “here to stay” interest.
- A consistent focus on the big picture is critical for gold and silver market investors. I cover that picture 5-6 times a week in updates just like this one, in my flagship Galactic Updates newsletter. At $199/year, investors feel the price is too low, and I’m doing a $179/15mths special offer that investors can use to get in on the winning action. Click this link to get the offer or send me an email and I’ll get you a payment link. Thanks!
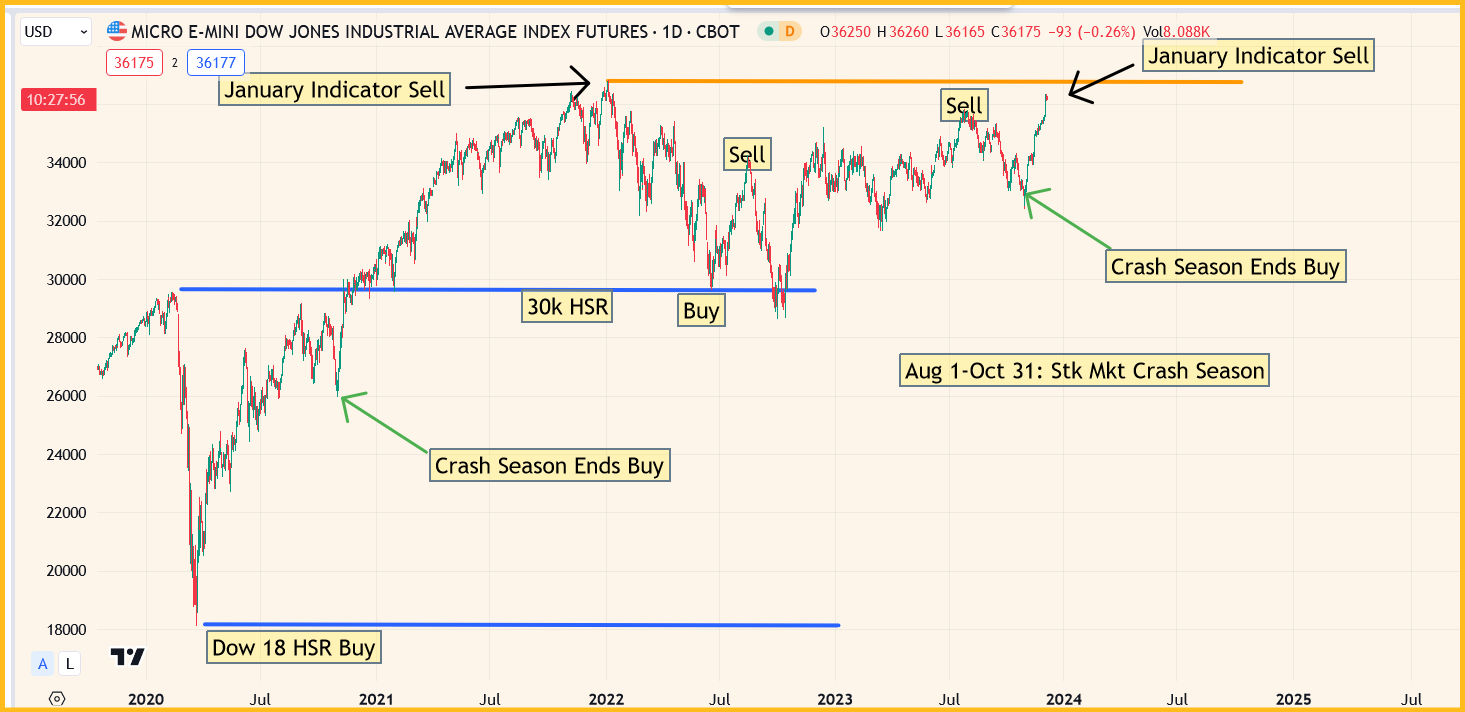
- Please click here now. Double-click to enlarge this US stock market chart. Key buy and sell zones are highlighted.
- I use the one week “January indicator”; if the market is up for the first week of trading in the new year, it’s usually a good indication that money managers are committed to consistent buying throughout the year.
- If the market is down at the end of that first week, they tend to be non-committal, and remain that way for the whole year.
- A tumbling stock market would be more fuel for lower rates, even if the Fed doesn’t cut. That’s because panicked investors would rush to buy bonds, pushing bond prices up and interest rates down.
- I always urge stock market investors to get out of the stock market on Aug 1, get back in later in October, and exit again in December. This is a time to book profits, stand back, and watch the first week of trading in January. It could get ugly, and fast!
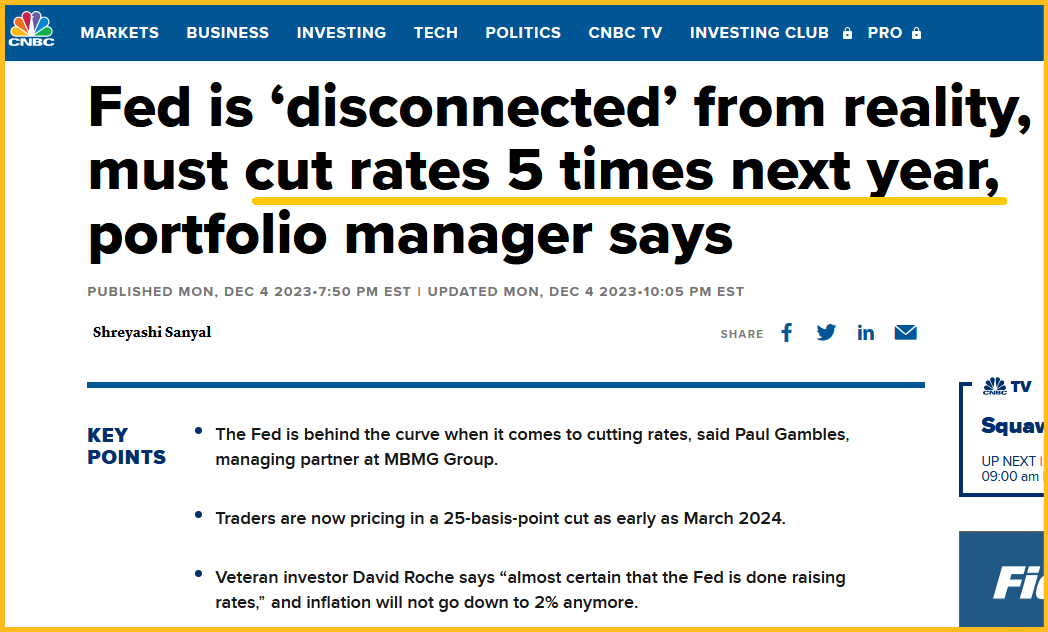
- Please click here now. I’ll dare to suggest that most mainstream money managers are more out of touch with reality than Fed chair Jay. Having said that, Jay should have hiked a lot more than he did, but targeted those aggressive hikes only at government debt, while offering relief and stimulus to debtors in the private sector. With the stock market at nosebleed valuation levels, rate cuts are not needed, but they are likely to happen if it tumbles.
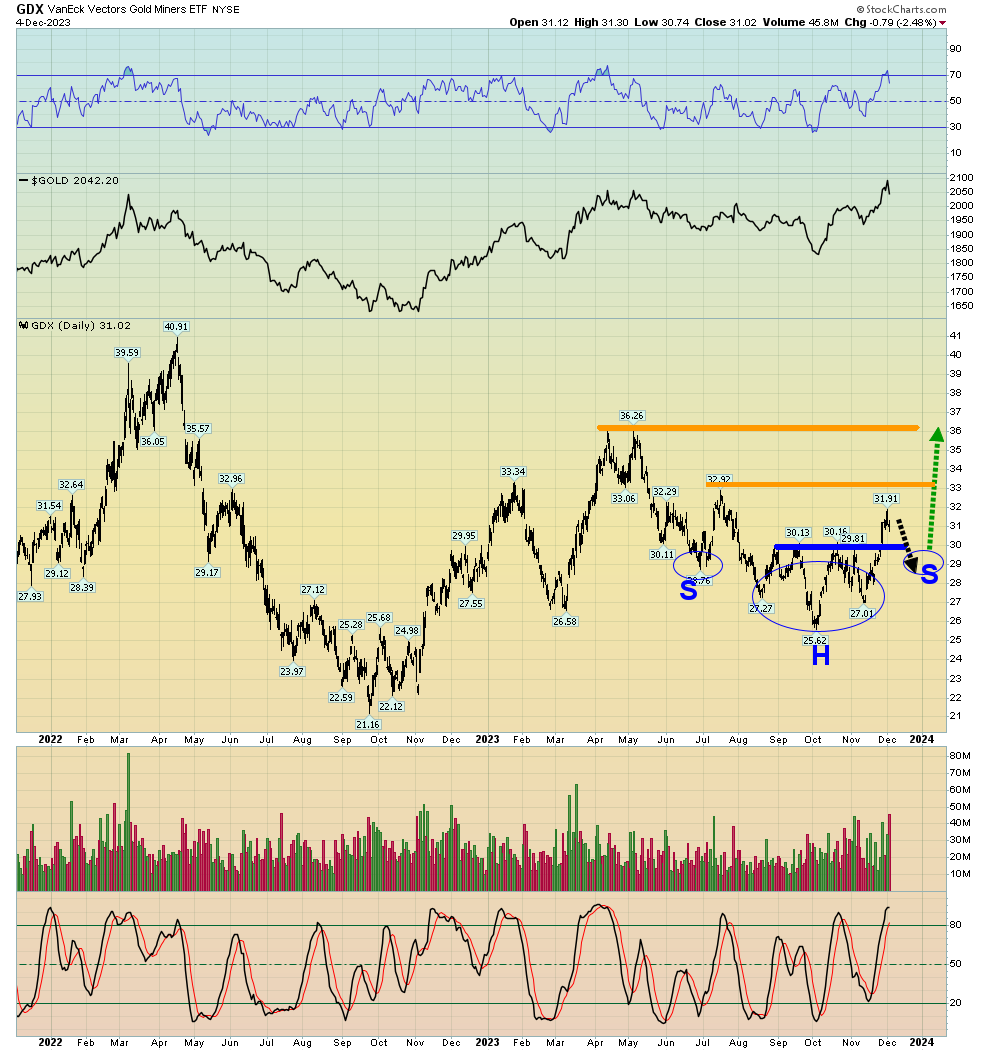
- With all of the above in mind, please click here now. Double-click to enlarge this stunning GDX chart. A textbook inverse H&S pattern (with breakout) is now the head of what could be a much bigger pattern. While the gold bullion market action is wild, GDX and most gold stocks look great! The right shoulder build could take GDX to just under $29, but it doesn’t need to go that low.
- Friday is the next jobs report. That could mark the low of the pullback and put gold in the buy zone, somewhere between $2010 and $1985. If that’s not the low, it’s likely just days away from there. Both traders and accumulators should keep their fingers on the buy button, ready to usher in a new and very golden year!
Thanks!
Cheers
st
Dec 5, 2023
Stewart Thomson
Graceland Updates
website: www.gracelandupdates.com
email for questions: stewart@gracelandupdates.com
email to request the free reports: freereports@galacticupdates.com
Tuesday 14th Jul 2026
Special Offer for 321gold readers: Send an email to freereports@galacticupdates.com and I'll send you my free “Gold & Silver Stocks Launchpad” report. I highlight four key CDNX miners that could surge 50% higher once the CPI and PPI report mayhem is over! Solid investor tactics are included in the report.
|
Graceland
Updates Subscription Service: Note we are privacy oriented. We accept cheques.
And credit cards thru PayPal only on our website. For your protection
we don't see your credit card information. Only PayPal
does.
| Subscribe via major credit cards
at Graceland
Updates
- or make checks payable to: "Stewart Thomson" Mail
to: Stewart Thomson / 1276 Lakeview Drive / Oakville, Ontario
L6H 2M8 / Canada |
Stewart
Thomson
is a retired Merrill Lynch broker. Stewart writes the Graceland
Updates daily between 4am-7am. They are sent out around 8am. The
newsletter is attractively priced and the format is a unique numbered
point form; giving clarity to each point and saving valuable
reading time.
Risks, Disclaimers,
Legal
Stewart
Thomson is no longer an investment advisor. The information provided
by Stewart and Graceland Updates is for general information purposes
only. Before taking any action on any investment, it is imperative
that you consult with multiple properly licensed, experienced
and qualifed investment advisors and get numerous opinions before
taking any action. Your minimum risk on any investment in the
world is 100% loss of all your money. You may be taking
or preparing to take leveraged positions in investments and not
know it, exposing yourself to unlimited risks. This is highly
concerning if you are an investor in any derivatives products.
There is an approx $700 trillion OTC Derivatives Iceberg with
a tiny portion written off officially. The bottom line:
Are
You Prepared?
321gold Ltd
 |
