 Graceland Updates 4am-7am Graceland Updates 4am-7am
Old and New Gold Trix
Stewart Thomson
email: s2p3t4@sympatico.ca
Nov 18, 2008
- A few years back, Stochastics
was the hottest technical indicator in town. It is a momentum
indicator. Momentum refers to the rate of change in the price
of an item. The stochastics indictor was invented over 50 yrs
ago. A solid workhorse. In any technical trader's toolbox.
- As the gold price "pendulum"
swings higher or lower, the stochastics gives buy and sell signals
as the two lines cross. Known as the "D" and "K"
lines.
- The stochastics can also give
buy or sell signal signals to some traders simply by falling
or rising to extreme levels. 20 and 80 are two well respected
markers.
- If the stochastics lines begin
a reversal of direction, while the price keeps in the same direction,
a "divergence" signal can be given.
- The growth of computerized
trading has produced a lot of false signals for poor Mr. Stochastics.
Now traders try to anticipate the turns, causing even more false
moves. The stop losses are small, but there's a lot more of them.
Since gold trended down from 1030, the stochastics have generated
a number of buy signals. Each rally has generally disappointed
gold investors.
- Enter the MACD. Arguably, the most popular indicator
amongst the technicans today.
- MACD is a slightly slower
indicator than stochastics, but more reliable.
- Simply put, if the MACD is
above the zero line, that means: the 12 day moving average is
trading above the 26 day ema. If the MACD lines are both below
zero, well, then 12 day ema is priced below the 26. Simple.
- The standard way to play the
MACD for gold bulls is: wait for the indictors to fall to low
levels, then rise up in a crossing of the two lines. The cross
is the buy signal.
- A second cross at or
above the zero line is seen as more positive still. The zero
line is the point where the 12 and 26 day ema's are both at the
same price level.
- Also, a "divergence"
between current prices and the MACD is watched carefully. The
MACD may start to turn up while prices continue down.
- The huge forced selling by
hedge and index funds has some traders questioning the MACD now.
The weekly gold charts have shown the MACD at the lowest point
of the whole bull mkt several times. Making gold and silver prices
seem "ridiculously cheap". And, as we all know, gold
and silver prices ARE ridiculously cheap but the seasonal rally
is long overdue, let alone new highs. The daily stochastics and
MACD have both given some short term signals, but it's all been
washed away each time. Very disappointing for gold investors.
- Enter the "home run"
derby king. The TRIX indicator. When markets are soaked
in volatility, most traders are looking to move faster and faster.
That is getting them into a lot of trades, but out of them just
as fast too. I would suggest that the answer to high volatility
is the opposite. Trade only the biggest and most reliable signals.
That calls for the Trix. If you are looking to step up to the
gold plate and knock the ball right out of the park we suggest
you keep a VERY close eye on our good friend Mr. Trix.
- Like stochastics, the Trix
is a momentum indicator. More reliable than both stochastics
and MACD. Following the trix requires patience. If you like watching
heavyweight boxing, you will LOVE the trix. Especially on the
monthly charts. The trix indicator may be a little slower, but
when signals are given, they are VERY reliable and come with
devastating "knockout" power.
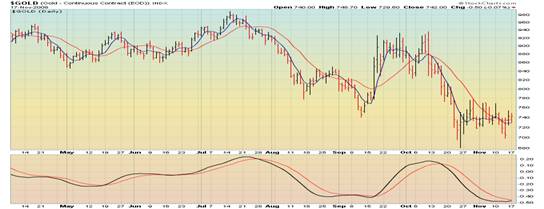
- Enclosed here are the current
gold charts showing the Trix indicator... alone. The first chart,
the daily gold chart, shows the Trix on the verge of giving a
very tradeable buy signal. Gold traders need a boost in
morale right now so this is a welcome event. If we get a full
signal... which could come this week.
- Keep in mind, that until the
weekly and monthly MACD actually gives a crossover signal, there
is no way the Trix Indicator is going to be giving one of its
home run buy signals for Gold. That WILL come but extreme
patience is needed as the fund industry is broken. And selling
is now out of control.
- When the monthly gold chart
gives its next Trix buy signal, it may be the greatest bull signal
of all time.
- In the meantime, the Trix
indicator on the gold monthly charts is suggesting, sadly, this
rally may not be the final bottom for gold. As Jim Rogers has
said about the stock market... "This looks like A bottom.
Not THE bottom".
- You can also see on these
charts my use of simple (not exponential) moving averages on
the price chart. The 5 and 15. The 5 is enough to smooth out
the short term action. While the 15 eliminates false signals.
Applied to the monthly gold chart, the profits can be astronomical.
In 2001 a buy signal was given at about $275 an ounce. The
5-15 moving average signal to take profits was given only once
during the whole bull mkt. In the fall of this year. At $850,
a fantastic run.

###
Stewart Thomson
Graceland Updates
website: www.gracelandupdates.com
email for questions: stewart@gracelandupdates.com
email to request the free reports: freereports@galacticupdates.com
Tuesday 2nd Jun 2026
Special Offer for 321gold readers: Send an email to freereports@galacticupdates.com and I'll send you my free “Junior Tools Of The Golden Trade!” report. I cover 10 junior miners (copper, gold, silver, and uranium) that seem eager to surge 100% higher as the metals surge higher too. Solid investor tactics are included in this report.
|
Graceland
Updates Subscription Service: Note we are privacy oriented. We accept cheques.
And credit cards thru PayPal only on our website. For your protection
we don't see your credit card information. Only PayPal
does.
| Subscribe via major credit cards
at Graceland
Updates
- or make checks payable to: "Stewart Thomson" Mail
to: Stewart Thomson / 1276 Lakeview Drive / Oakville, Ontario
L6H 2M8 / Canada |
Stewart
Thomson
is a retired Merrill Lynch broker. Stewart writes the Graceland
Updates daily between 4am-7am. They are sent out around 8am. The
newsletter is attractively priced and the format is a unique numbered
point form; giving clarity to each point and saving valuable
reading time.
Risks, Disclaimers,
Legal
Stewart
Thomson is no longer an investment advisor. The information provided
by Stewart and Graceland Updates is for general information purposes
only. Before taking any action on any investment, it is imperative
that you consult with multiple properly licensed, experienced
and qualifed investment advisors and get numerous opinions before
taking any action. Your minimum risk on any investment in the
world is 100% loss of all your money. You may be taking
or preparing to take leveraged positions in investments and not
know it, exposing yourself to unlimited risks. This is highly
concerning if you are an investor in any derivatives products.
There is an approx $700 trillion OTC Derivatives Iceberg with
a tiny portion written off officially. The bottom line:
Are
You Prepared?
321gold Ltd

|
